Question 1
A sample of urban adult residents of CA revealed that 120 favorably approved of the incumbent president’s job performance, whereas a sample of rural residents yielded 75 who favorably approved of the incumbent president. We are interested in testing whether or not there is a difference in perception of the incumbent president’s performance across the two groups.
(a) (5 points) Let be the responses of the urban residents and be the responses of the rural residents. In the setting of this problem, describe the distributions these random variables are sampled from.
SOLUTION
(b) (5 points) Identify the main parameter of interest, .
SOLUTION
(c) (5 points) Write down the expression for the statistic , which is our best guess for the population parameter .
SOLUTION
(d) (5 points) Write down the null and alternative hypothesis for the question.
SOLUTION
- :
- :
(e) (5 points) What would the ideal rejection region look like for rejecting in favor of ?
SOLUTION
The ideal rejection region will be the 2 sides away from . We reject if our observed statistic is significantly larger than 0 or significantly smaller than 0.
(f) (5 points) Assuming the null hypothesis is true, what is the sampling distribution of ? (Hint: Use CLT approximation for the sampling distribution of the statistic which we have encountered in class earlier. You just need to write down what this sampling distribution is under )
SOLUTION
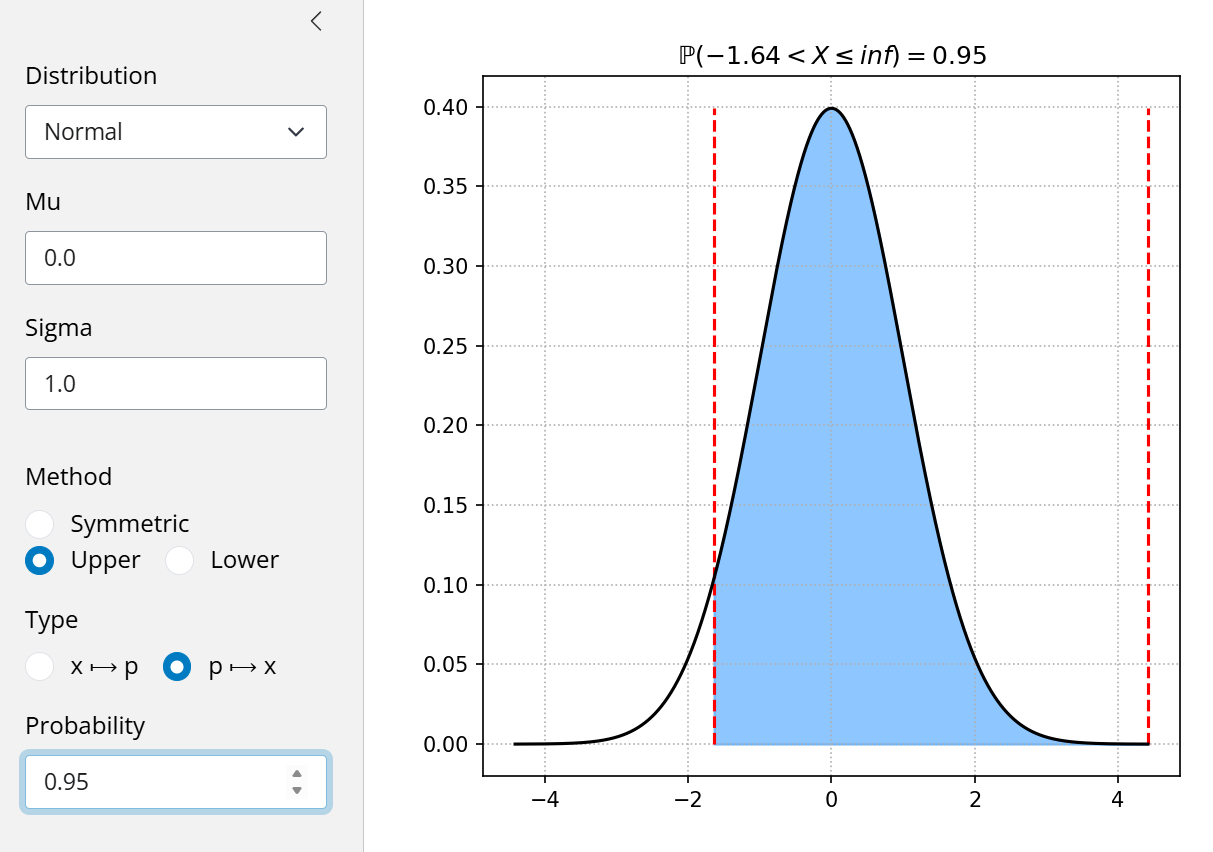
(g) (15 points) By setting to be the Type-I error probability, write down the final expression for the rejection region in terms of .
SOLUTION
(h) (5 points) Fixing find the level- rejection region .
SOLUTION
(i) (5 points) What is your final decision is based on the level hypothesis test?
SOLUTION
Since is not within the rejection region, we failed to reject with
(j) (5 points) Compute the p-value for the hypothesis test, and specify what your decision will be if you were to, instead, perform a level hypothesis test.
SOLUTION
Since p-value we have failed to reject the null hypothesis with
Question 2
In a study to estimate the average height of adult male basketball players, a researcher wants to test if the average height is greater than 200cm. Prior studies indicate that the variance in height is .
(a) (10 points) Write down any assumptions about the data and identify the setting of the problem.
SOLUTION
: The average height of a random chosen male adult basketball player
(b) (10 points) From part (a), identify the relevant population parameter, , and the sample statistic, , the researcher will use to make any statistical inference.
SOLUTION
: the true population mean of the height of adult male basketball players () : The sample proportion mean of the height of adult male basketball players ()
(c) (10 points) The researcher wants to compute a two-sided 99% confidence interval for the sample statistic . If they want the margin of error to be 0.01cm, what is the minimum number of samples needed?
SOLUTION
(d) (10 points) In part (c), the researcher uses a two-sided confidence interval. In words, describe why/why not this type of a confidence interval is appropriate for the research question they wish to investigate.
SOLUTION
The two-sided confidence interval is inappropriate because the research question is directional (testing if heights are greater than 200cm). A two-sided interval wastes statistical power by accounting for a ‘less than’ direction that the researcher is not investigating; a one-sided lower bound would more accurately align with the alternate hypothesis.
(e) (10 points) Write down the appropriate null and alternate hypotheses for the question.
SOLUTION
: :
(f) (10 points) The researcher aims to have a power of 80% to detect an actual average height of 202cm. What sample size is required for this test at a significance level?
SOLUTION
Sampling Distribution:
Reject if :
Calculate Power:
We found the and use it to find
Question 3
A clinical trial is needed to compare the efficacy of a new diabetes drug in comparison to the baseline . Prior pilot studies found the standard deviations for both drugs to be units and units. The FDA requires there to be a reduction of in blood sugar to be considered “innovation” in order to release the drug into the market. Furthermore, all results need to be reported at a statistical significance level of .
(a) (10 points) State the main assumptions in this problem and identify the problem setting.
SOLUTION
: The reduced blood sugar of a randomly chosen participant who used the drug : The reduced blood sugar of a randomly chosen participant who used the drug
(b) (10 points) Identify the population parameter and sample statistic the researchers are interested in.
SOLUTION
: The difference of the true means of the new drug with the baseline () : The difference of the sample means of the new drug with the baseline ()
(c) (10 points) Identify the null and alternate hypotheses for this problem which will enable the researchers to make the necessary statistical inference.
SOLUTION
(d) (10 points) The units for the standard deviation are intentionally left as units. What units should these be for this problem to make sense?
SOLUTION
When calculating sample distribution, the values of the numerator and denominator must be the same for the distribution to be unitless:
Since we know , the unit for must also have the unit:
(e) (10 points) Suppose the researchers choose to recruit volunteers for the research study and randomly split half of them to the two groups, i.e., to take drug X and the remaining volunteers to take the drug Y. What is the minimum sample size, , needed to detect if the new drug improves on the baseline with power 90%?
SOLUTION
- ,
I. Sampling Distribution:
where:
II. Sampling Distribution if is true:
III. Reject if:
IV. power
We found the and use it to find
Question 4
In an upcoming national election, you are in charge of conducting exit polls to predict the winner. The race is between two parties: the orange party and the purple party. You decide to conduct a one-sided population proportion hypothesis test to assess the proportion of voters favoring the purple party candidate.
(a) (10 points) Write down the appropriate assumptions about the data, identify the population parameter of interest, , and the sample statistic, , you intend to use.
SOLUTION
: The response of a randomly chosen individual whether or not they favor the purple party over the orange party
: The true population proportion that favors the purple party over the orange party () : The sample proportion that favors the purple party over the orange party ()
(b) (20 points) Identify the null and the alternate hypotheses which will enable you to make the necessary inference for this question. Describe the sampling distribution of the sample statistic under the null hypothesis and the alternate hypothesis.
SOLUTION
Sampling Distribution if is true:
where
Sampling Distribution if is true:
Standard Error:
(c) (20 points) Based on prior studies in electoral contexts, an election is considered to have a “moderate level of support” when the true population proportion is 55% or greater. Anything less than that is considered to be a “small margin”. You want your test to have a power of at least 95%, when the true political sentiment in favor of the purple party candidate is a moderate level of support. What is the minimum sample size you would need to achieve this? Assume a significance level of .
SOLUTION
Reject if :
Power:
We found the and use it to find