1.
When the line current is held at 10 amps for a speed of 1,500 rpm, the true mean stray-load loss for a certain type of induction motor is (watts). Assume that stray-load loss is normally distributed with
(a) (10 points)
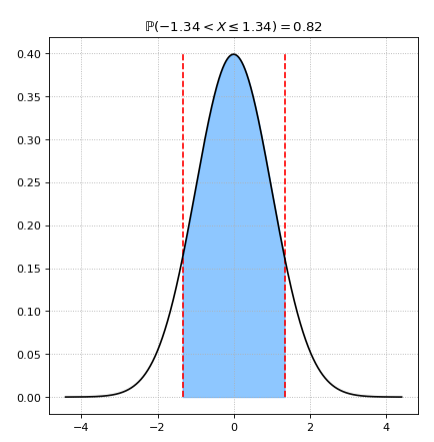
Compute an 82% confidence interval for when and Interpret the confidence interval in the context of the problem.
Solution:
- Parameter of Interest:
- Sample Statistic:
- Sampling Distribution:
- Standard Error:
- ,
- Confidence Interval:
Interpretation: We are confident that the true mean stray-load loss for this type of induction motor is between and watts.
(b) (10 points)
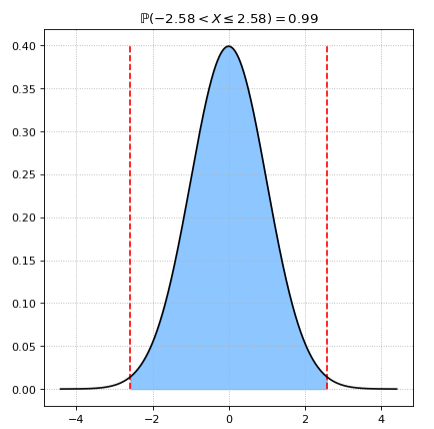
How large must be if the width of the 99% confidence interval for is required to be 1.0?
Solution:
let
2. (20 points)
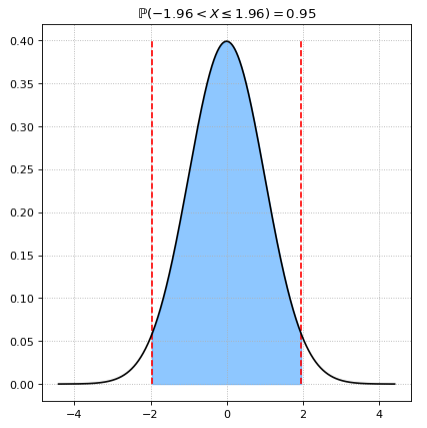
A journal article reports that a sample of size was used as a basis for calculating a 95% confidence interval for the true mean natural frequency (Hz) of delaminated beams of a certain type. The resulting confidence interval was . You decide that a confidence level of 99% is more appropriate than the 95% level used. What are the limits of the 99% interval? Assume that the data collected follows a Normal distribution.
Solution:
First find all information required that can be extracted by the given Confidence interval, sample size, and
Next, compute the Confidence Interval if wanting confidence:
3. (20 points)
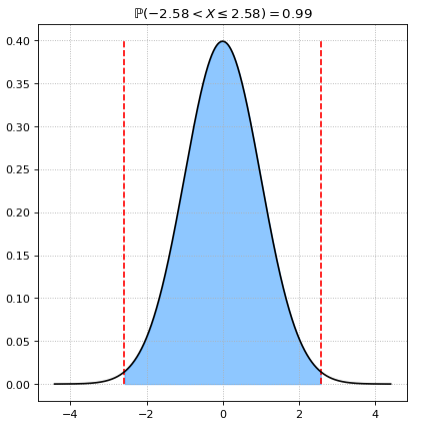
A sample of 66 adults were put on a low-carbohydrate diet for a year. The average weight loss was 11 lbs and the standard deviation was 19 lbs. Compute an upper 99% confidence interval for the true average weight loss. What does the interval say about our confidence that the mean weight loss is positive?
Solution:

Since the entire lower confidence interval is above zero, we are 99% confident that the mean weight loss is positive.
4.
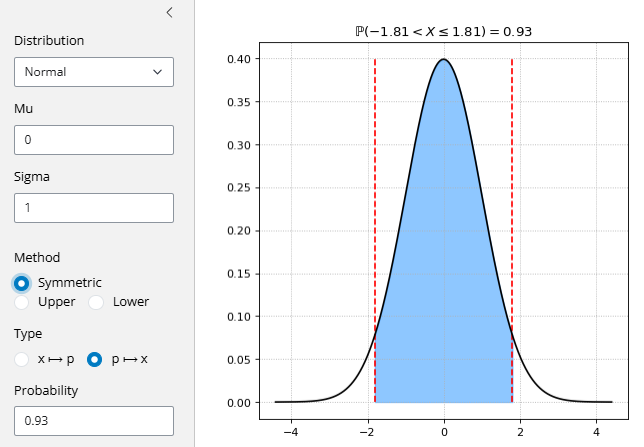
A survey was conducted on people at UCSD where people were asked whether or not they use TikTok. The researchers found the (two-sided) 93% confidence interval for to be . Using this information:
(a) (10 points)
Compute an upper 93% confidence interval for the population proportion p.
Solution:
What we know from the given information:
Use the given information, we can find:
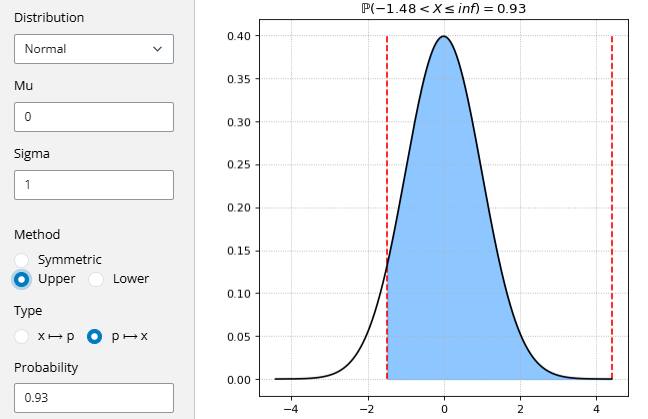
Therefore the upper confidence interval can be found as the following
Since we are finding the proportion, the ultimate bound will be:
(b) (10 points)
Compute a lower 93% confidence interval for the population proportion p.
Solution:
Using the same given information we found from part a:
Since we are finding the proportion, the ultimate bound will be:
(c) (5 points)
Suppose the researchers wanted to make the case that: “with 93% confidence at least fraction of the UCSD student population uses Tik Tok” where is some number between 0 and 1. Which of the three types of confidence intervals (upper, lower, or two-sided) is appropriate?
Solution:
The upper confidence interval is more appropriate
(d) (5 points)
Provide an interpretation for the confidence interval you chose in part (c). Why?
Solution:
This interval provides a minimum value (lower bound) that we are 93% confident the true population proportion exceeds. Since the upper confidence interval encapsulates the range from lower bound to
5. (12 points)
Let and let For the following pairs of assertions: 1. Indicate whether they constitute a valid hypothesis test, and 2. Why they do (or don’t) constitute a valid hypothesis test
Solution:
- VS.
- This does not constitute a valid hypothesis test
- The alternate hypothesis is based on sample mean instead of true mean
- VS.
- This does not constitute a valid hypothesis test
- The null hypothesis is not disjoint from the alternative hypothesis
- vs.
- This does constitute a valid hypothesis test
- Both hypotheses refer to the same population parameter; The null hypothesis is disjoint from the alternative hypothesis
- vs.
- This does not constitute a valid hypothesis test
- is a sample statistic, which is a random variable
- vs.
- This does not constitute a valid hypothesis test
- The null hypothesis set is bigger than the alternative hypothesis set
- vs.
- This does not constitute a valid hypothesis test
- There is a gap that the alternative hypothesis fail to capture
6.
For each of the following scenarios: write down your assumptions about the distribution of the data, then write down the null hypotheses and the alternate hypotheses which enable testing the main question of interest, e.g., and vs. .
(a) (5 points)
A school counselor believes that less than 60% of students participate in extracurricular activities. To test this hypothesis, she conducts a survey of a random sample of 200 students in the school, asking whether they participate in any extracurricular activities.
Solution:
Each student either participates in extracurricular activities or not, therefore the distribution of the data is:
(b) (5 points)
A researcher wants to know if the proportion of students who own a smartphone is different between high school and middle school students. He collects data by randomly sampling 150 high school students and 150 middle school students and asks them whether they own a smartphone.
Solution:
Each student either owns a smartphone or not, with 2 groups:
With representing the response of high school students, and representing the response of middle school students
(c) (5 points)
A comprehensive national survey found that people read, on average, 5 books every 3 months. A skeptical teacher thinks that this is an over-estimate when it comes to the college student subpopulation. So, she collects data by asking every student in her class to report the number of books they have read during the fall quarter.
Solution:
Since the statistic wants to find the mean of the books read in a fixed time interval, we use Poisson Distribution for the class survey:
(d) (5 points)
A nutritionist believes that the average daily calorie intake of teenagers is more than 500 calories higher than that of children. To test this hypothesis, she conducts a study where she asks a random sample of 100 teenagers and 120 children to record their daily calorie intake for a week.
Solution:
Since the statistic is finding the average in two groups to test the difference, we use 2 groupings, both with Normal Distributions:
Where represents the calorie intake of a teenager and represents the calorie intake of a child
7.
For the hypothesis testing of the population mean, suppose the test statistic has a standard normal distribution when is true. Calculate the Type-I error probability for each of the following situations:
(a) (5 points)
, and the rejection region is
Solution:
(b) (5 points)
, and the rejection region is
Solution:
(c) (5 points)
and the rejection region
Solution:
8.
The melting point of each of samples of a brand of hydrogenated vegetable oil was determined, resulting in Assume that the distribution of is normal with known .
(a) (5 points)
For the hypotheses vs. calculate the rejection region at level .
Solution:
(b) (5 points)
For the same test with test, what is the probability of a Type-II error when the true under ?
Solution:
(c) (5 points)
Compute the p-value of the two-tailed hypothesis test, and conclude whether this p-value agrees with your conclusion from part (a).
Solution:
From part (a), the mean is outside of the rejection region, therefore part (a) will conclude it failed to reject null hypothesis.
From part (c), the , therefore part (c) will also conclude it failed to reject null hypothesis as p-value is the smallest rate can be to reject
In conclusion, this p-value agrees with the conclusion from part a
9.
In a study to assess cardiovascular health, researchers measured heart rate recovery after moderate exercise. For athletes and non-athletes, the summary statistics for the average recovery rate (measured as decrease in beats/minute in a five minute window) is given in Table 1.
| Sample | Number of samples | Sample Mean () | Sample Variance () |
|---|---|---|---|
| Athletes | |||
| Non-athletes |
Table 1: Cardiovascular data summary
(a) (3 points)
Consider testing vs. . Describe, in words, what says.
Solution:
represents the true mean heart rate recovery rate for non-athletes differs by that of the athlete’s by more than 1 beat per minute
(b) (5 points)
At level , find the level-a rejection region .
Solution:
We know:
- ,
Using what we know:
(c) (5 points)
For the same find the lower confidence interval for .
Solution:
(d) (5 points)
What is the relationship between the rejection region and the lower confidence interval ?
Solution:
The contains all values for the null hypothesis that would not be rejected by the test
(e) (5 points)
What is the probability of a Type-II error when the actual difference between and is ?
Solution:
(f) (5 points)
Find the p-value for a hypothesis test of vs. and conclude what your decision will be at level
Solution:
By using , we can find the p-value to be:
As such we can conclude to reject the null hypothesis as