1.
For each of the following questions you only need to write down the final answer with a brief justification for why you claim your answer is true. You don’t need to derive anything.
(a) (5 points) Let . What is the sampling distribution of ?
SOLUTION
By the definition of the Binomial Distribution
(b) (5 points) Let . What is the sampling distribution of ?
SOLUTION
By the Algebra of Poison Random Variables
(c) (5 points) Let . What is the sampling distribution of ?
SOLUTION
By the Algebra of Normal Random Variables
(d) (5 points) Let . What is the sampling distribution of ?
Hint: Refer to Probability, Statistics & Data, Theorem 5.4, or Week-4 slides.
SOLUTION
By Theorem 5.4:
has a distribution with degrees of freedom
Therefore:
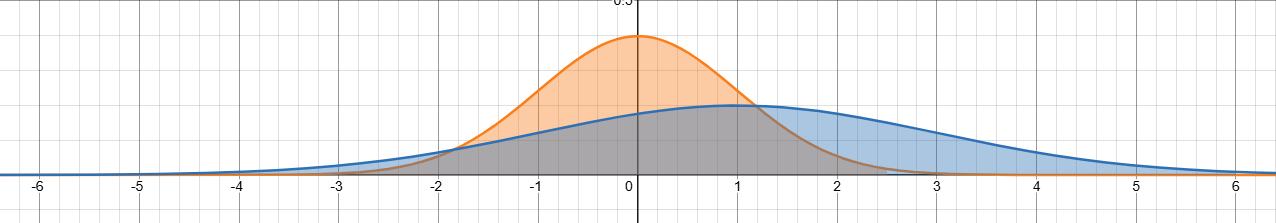
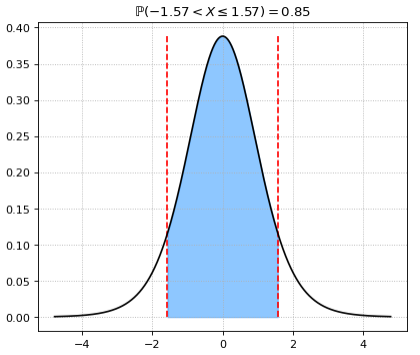
(e) (10 points) Let and . Let . What is the relationship between and such that ? If , , and , draw an illustration of these two quantities in the same plot.
SOLUTION
By the process of Standardization:
as such the relationship between and is:
When , , and , can be found as:
Below is the plot illustration of the two distributions where
- Orange →
- Blue →
2.
Bob is a budding social media influencer who is hoping to make it big in the TikTok influencer space. Suppose you work at TikTok, and you know that each of Bob’s TikToks go viral with probability .
(a) (5 points) For a TikTok posted by Bob, let be the outcome where if viral and if not. What is the distribution of ?
SOLUTION
- (b) (5 points) Bob conducts an experiment with TikToks. In words, what does measure?
SOLUTION
(c) (5 points) Write the sampling distribution of and its PMF .
SOLUTION
(d) (5 points) Write Bob’s best guess for in terms of .
SOLUTION
(e) (5 points) In words, describe the events for and for .
SOLUTION
Bob’s experiment observed his TikTok going viral has a probability greater than some probability
The number of videos going viral observed is more than some value
(f) (5 points) If , what is the relationship between and ?
SOLUTION
From the previous subproblems, we can find the event
Given the condition, we can compare that
For these two comparisons to have the same number of occurrence, the following relationship must be true:
(g) (5 points) Write the mathematical expression for event : Bob’s estimate is greater than 20%.
SOLUTION
(h) (5 points) Using parts (e) and (f), write the final expression for the probability that in terms of a Binomial probability.
SOLUTION
3.
Bob recognizes that his answer for Question 2 is annoying to compute since it involves sums of Binomial probabilities. So, he remembers that there was some way of using the central limit theorem to get the final answer.
(a) (5 points) What is and for in Question 2?
SOLUTION
(b) (5 points) Using HW-3 properties, what is and ?
SOLUTION
(c) (5 points) Using the CLT, let . What is the approximate distribution of ?
SOLUTION
Since follows the CTL’s equation where:
has an approximate distribution of
(d) (5 points) For , what is the relationship between and such that ?
SOLUTION
From the previous subproblems, we can find the event
Given the condition , we can compare that
For these two comparisons to have the same number of occurrence, the following relationship must be true:
(e) (5 points) Express the probability of event from Question 2(g) using the standard normal CDF .
SOLUTION
From 2g:
With the calculated :
4.
A survey was conducted on n = 200 participants from the United States asking: “Who did you vote for in the 2024 elections?”. A summary of the responses is below:
| Response | Respondents |
|---|---|
| Red Party | 85 |
| Blue Party | 115 |
(a) (5 points) Let be a placeholder for whether a participant votes Blue. What is the distribution for ?
SOLUTION
Since represents individual trials of participant:
(b) (5 points) What is the population parameter of interest? Interpret its meaning.
SOLUTION
The population parameter of interest is : the true proportion of all voters in the US who votes Blue
(c) (5 points) What is the best guess based on the data? Is this a statistic or a parameter?
SOLUTION
Since this is a value calculated from sample data, this is a statistic
(d) (5 points) Write the sampling distribution for .
SOLUTION
(e) (5 points) Construct a 95% confidence interval for .
SOLUTION
Given a interval, the value for and are:
Finding Standard Error:
Now having all the information needed, find the Confidence Interval:
(f) (5 points) Provide a brief interpretation of the interval from part (e).
SOLUTION
The Confidence Interval found represents a confident that the true proportion of US voters voting for the Blue party to be between and
(g) (5 points) A critic says this interval is only valid if is Normal or approximately Normal. Is this true for this data? Explain.
SOLUTION
The critic is right that this interval is valid only when is approximately Normal since it relies on the assumption that the sampling distribution is a Normal Curve (Bell)
This data follows a Normal Distribution since both Red and Blue party counts are large enough to model using Normal distribution.
(h) (5 points) A headline says “The Blue party will win the 2024 elections!“. Does this align with your findings? Rephrase it better.
SOLUTION
This headline is not accurate as the lower bound found was , which has a decent probability that the result of the election will result in a tie or Red Party’s victory.
A better way to phrase this finding is:
“The Blue party is currently in favor to win, but the results remain close”
5.
A survey was conducted on participants from UCSD asking: “Do you think Artificial Intelligence (AI) is going to replace our jobs?”. In addition to the responses to this question, the participants were also asked what their broad major was. The breakdown of the responses by major is below:
| Major \ Response | Yes | No |
|---|---|---|
| Science & Engineering | 80 | 40 |
| Arts & Humanities | 50 | 30 |
We are interested in constructing a confidence interval for the difference in opinions about AI for Science & Engineering majors vis-á-vis Arts & Humanities majors. Let be the response of a randomly chosen student with a Science & Engineering major, and let be the response of a randomly chosen Arts & Humanities major with population parameters and respectively
(a) (5 points) What is an appropriate distribution for and ?
SOLUTION
(b) (5 points) Let . Interpret this in context.
SOLUTION
: the true proportion of the Science and Engineering students answering “Yes” : the true proportion of the Arts and Humanities students answering “Yes”
As such, the expression represents the true difference between the proportion of the 2 categories of majors believe that AI is going to replace their jobs
(c) (5 points) Write the expression for and compute its value.
SOLUTION
(d) (5 points) Compute , the standard error for the estimator.
SOLUTION
(e) (5 points) Write the expression for a confidence interval for in terms of .
SOLUTION
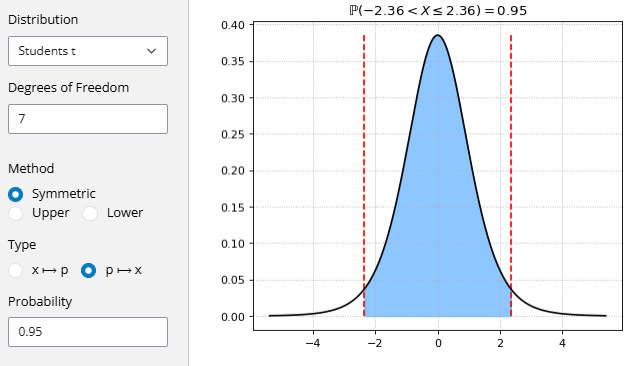
(f) (5 points) Compute for using a web applet (include screenshot).
SOLUTION
When
Based on the web app, the value for is given
(g) (5 points) Write the final 90% confidence interval for .
SOLUTION
(h) (5 points) Is there sufficient evidence of a difference in perceptions between the groups? Why/why not?
SOLUTION
There are no evidence of a difference in perceptions between the two groups because with the difference’s confidence interval including suggests there is no significant difference between the result of the two groups.
6.
You work at a reputable polling agency covering the elections, and have recently conducted a survey with participants. You collect their responses and compute . Based on your analysis, you find that the margin of error at the confidence level is . You report these results to your boss, who says that the margin of error is too high, and that the margin of error should be less than at the confidence level. Assuming your estimate of remains the same as your original survey, what is the minimum number of participants you need in your new survey to satisfy your boss’s requirements? Provide screenshots justifying the use of any quantiles you use in this problem.
SOLUTION
With a confidence, the
Find the current
With this information, we can find the given a confidence interval to find :
when at confidence
7.
An confidence interval for a population mean, , is given as . This confidence interval is based on a simple random sample of observations. Calculate the sample mean and standard deviation which reproduce this confidence interval. Assume that all conditions necessary for inference are satisfied, and use the student’s t distribution wherever needed. Provide a screenshot justifying the use of any quantiles you use in this problem.
SOLUTION
Finding
Finding
at confidence
For a t-distribution, the Margin of Error is:
8.
The table below summarizes an experiment to answer this question. A total of 20 participants were recruited for the experiments and randomly assigned to two groups of size and . In the first group (), the participants were required to not use any electronic devices for at least an hour before they go to sleep. In the second group (), the participants were asked to doomscroll their favorite social-media platform before falling asleep. A wearable health device collected their sleep quality scores, and the sleep quality data is summarized in the table below:
| Group | n | ||
|---|---|---|---|
| X | 12 | 70.0 | 5.0 |
| Y | 8 | 60.0 | 10.0 |
(a) (5 points) Let . Interpret this in context.
SOLUTION
represents the true mean of group ‘s sleep quality represents the true mean of group ‘s sleep quality
As such, the expression represents the true difference in the mean of sleep quality scores between group and
(b) (5 points) What does 70.0 represent? Is it a parameter or statistic?
SOLUTION
The value represents the sample mean of group ‘s sleep quality score
Since this value is from the observation of the sample space, this is a statistic
(c) (5 points) Write the expression for and compute it.
SOLUTION
(d) (5 points) Write the expression for the confidence interval for in terms of , , and . Compute the degrees of freedom .
SOLUTION
Confidence Interval:
Degree of Freedom:
(e) (5 points) If , what is ? Include a screenshot.
SOLUTION
Based on this, when
(f) (5 points) Compute the 95% confidence interval for .
SOLUTION
(g) (5 points) Interpret the interval. Is there sufficient evidence that doomscrolling impacts sleep scores?
SOLUTION
With confidence, the true difference in mean sleep quality scores between those who avoid electronics and those who doomscroll falls between and points
There is sufficient evidence that doomscrolling impacts sleep scores since the confidence interval did not pass through , suggesting a significant improvement of sleep quality when avoiding electronics before sleep.