1
Let be random variables with expected value and variance for every . Let be given by
(a) (5 points)
Show that we can write for some . What are the values of ?
SOLUTION
the values for
(b) (5 points)
Using your answer for part (a) and using the linearity from Equation (1) from HW-2, show:
SOLUTION
(c) (10 points)
Using Equation (2) from HW-2 and your answer from part (a), show that
SOLUTION
2
Let be a discrete random variable with probability mass function given by
(a) (5 points)
Find the value of that makes a valid probability mass function.
SOLUTION
(b) (5 points)
Using the value of you obtained, find the expected value where . What is the support ?
SOLUTION
3 (10 points)
A die is tossed until the first six occurs. What is the probability that it takes 4 or more tosses?
SOLUTION Let
This is a Geometric Distribution where rolling ” or more tosses” means the first does not appear on tosses , , and
Need to find the CDF:
4
You reach the Nobel Drive station at 3:45 PM to catch the Blue Line trolley to campus. The screen at the terminal says that the trolley is scheduled to arrive at 4:00 PM. With probability 0.1 the trolley is running ahead of schedule and will arrive 5 minutes early. With probability 0.7 the trolley is running late and will arrive 10 minutes late. With the remaining 0.2 probability, the trolley is on time. Let be the random variable denoting the arrival time of the trolley.
(a) (5 points)
What is the support of , i.e., ?
SOLUTION
where:
- = arriving minutes early
- = arriving on time
- = arriving late
(b) (5 points)
Write down the probability mass function .
SOLUTION
(c) (5 points)
Calculate the expected arrival time .
SOLUTION
(continued)
Let be the random variable denoting the amount of time you have to wait for the trolley in minutes.
(a) (5 points)
Write down the support of , i.e., .
SOLUTION
where :
- = arriving early
- = arriving on time
- = arriving late
(b) (5 points)
Compute the expected value of , i.e., .
SOLUTION
(c) (5 points)
Compute .
SOLUTION
Find
Use this result and plug it back into the variance formula:
(d) (5 points)
What are the units of ?
SOLUTION The unit of should be minutes squared ()
5
Luke Kennard of the Memphis Grizzlies has a 3-point percentage (probability of making a 3-point shot) of .
(a) (5 points)
Let be a random variable that represents whether Luke makes a 3-point shot or not. Identify the most appropriate distribution for . Write down and .
SOLUTION
(b) (5 points)
Let be the number of attempts Luke needs to take in order to successfully make his first 3-point shot in the game. Identify the most appropriate distribution to model .
SOLUTION
Since the interest is how many trials before the first success, the most suitable model is the following:
(c) (5 points)
Find the expected value of and its variance.
SOLUTION
(d) (5 points)
In the upcoming game against Orlando Magic, suppose Luke attempts 3-point shots. Let be the number of successful 3-point shots Luke makes in these 50 attempts. What is the most appropriate distribution to model ? Write down its PMF .
SOLUTION
Since the random variable now represents the number of success out of trials, can be expressed by the following distribution:
The Probability Mass Function is as follows:
for any
(e) (5 points)
Find the expected value of and its variance.
SOLUTION
(f) (5 points)
Steph Curry of the Golden State Warriors has a 3-point percentage of . In the upcoming game against the Clippers, suppose Steph Curry attempts shots. Let be the number of successful 3-point shots Steph Curry makes in these 50 attempts. Do you expect to be greater than, less than, or equal to ? Justify your answer.
SOLUTION
Since Steph’s probability of success is lower, I expect to be greater than as the expected value grows as the probability of success grows
(g) (5 points)
What is the expected number of 3-point shots Steph Curry needs to attempt in order to successfully make his first 3-point shot in the game?
SOLUTION
Let
(h) (5 points)
Suppose Steph Curry and Luke Kennard face off to take a single 3-point shot. Let and be the random variables representing the outcome of the shot for Steph Curry and Luke Kennard, respectively. In words, what does the event represent? Compute .
SOLUTION
The event because the random variables and represents a single Bernoulli trial with the support of or . To have the event , the random variables must follow the pattern to satisfy the condition
6
Let and be two independent random variables. Let be a new random variable which is the maximum of and . In this question, we’ll derive the PDF for .
(a) (5 points)
Write down the expression for , where is the CDF of for .
SOLUTION
(b) (5 points)
What is ?
SOLUTION
(c) (5 points)
For some fixed , consider the events , . In words, describe the event .
SOLUTION
The expression reflects when both and . As such, the expression represents the event when both random variables and are at most
(d) (5 points)
Using the independence of and , write down the expression for
in terms of the CDFs and , respectively.
SOLUTION
(e) (5 points)
Using the expression for the CDF of the uniform distribution from part (a), derive the final expression for
SOLUTION
(f) (5 points)
How is the event related to the event ? Based on your answer, write down the expression for the CDF , i.e.,
SOLUTION
Since , the mapping for the sample space will be the same between and
(g) (10 points)
Now, using the relationship between the CDF and the PDF from the lecture (fundamental theorem of calculus), derive the expression for the PDF .
SOLUTION
7 (5 points)
Give an example of a probability density function whose associated continuous random variable has expected value 10, i.e., .
SOLUTION
Let
Given this continuous random distribution, the probability density function can be defined as:
To confirm this is a proper pdf, check if the CDF = 1
Therefore the is valid.
Next double check if the expected value equals to 10:
Therefore the given probability distribution function is accurate
8
In this question we’ll derive some intuition for the shape of the PDF for a Normal distribution . To this end, consider the following functions
and
For the following questions you need to illustrate your answers. For all diagrams use the limits on the x-axis to range from . A hand-drawn sketch is acceptable as long as you label your drawings/sketches appropriately. You can also use the free online tools at Desmos or GeoGebra to plot these functions.
(a) (5 points)
Sketch a plot of , and side by side for . Is it symmetric? Where is it centered?
SOLUTION
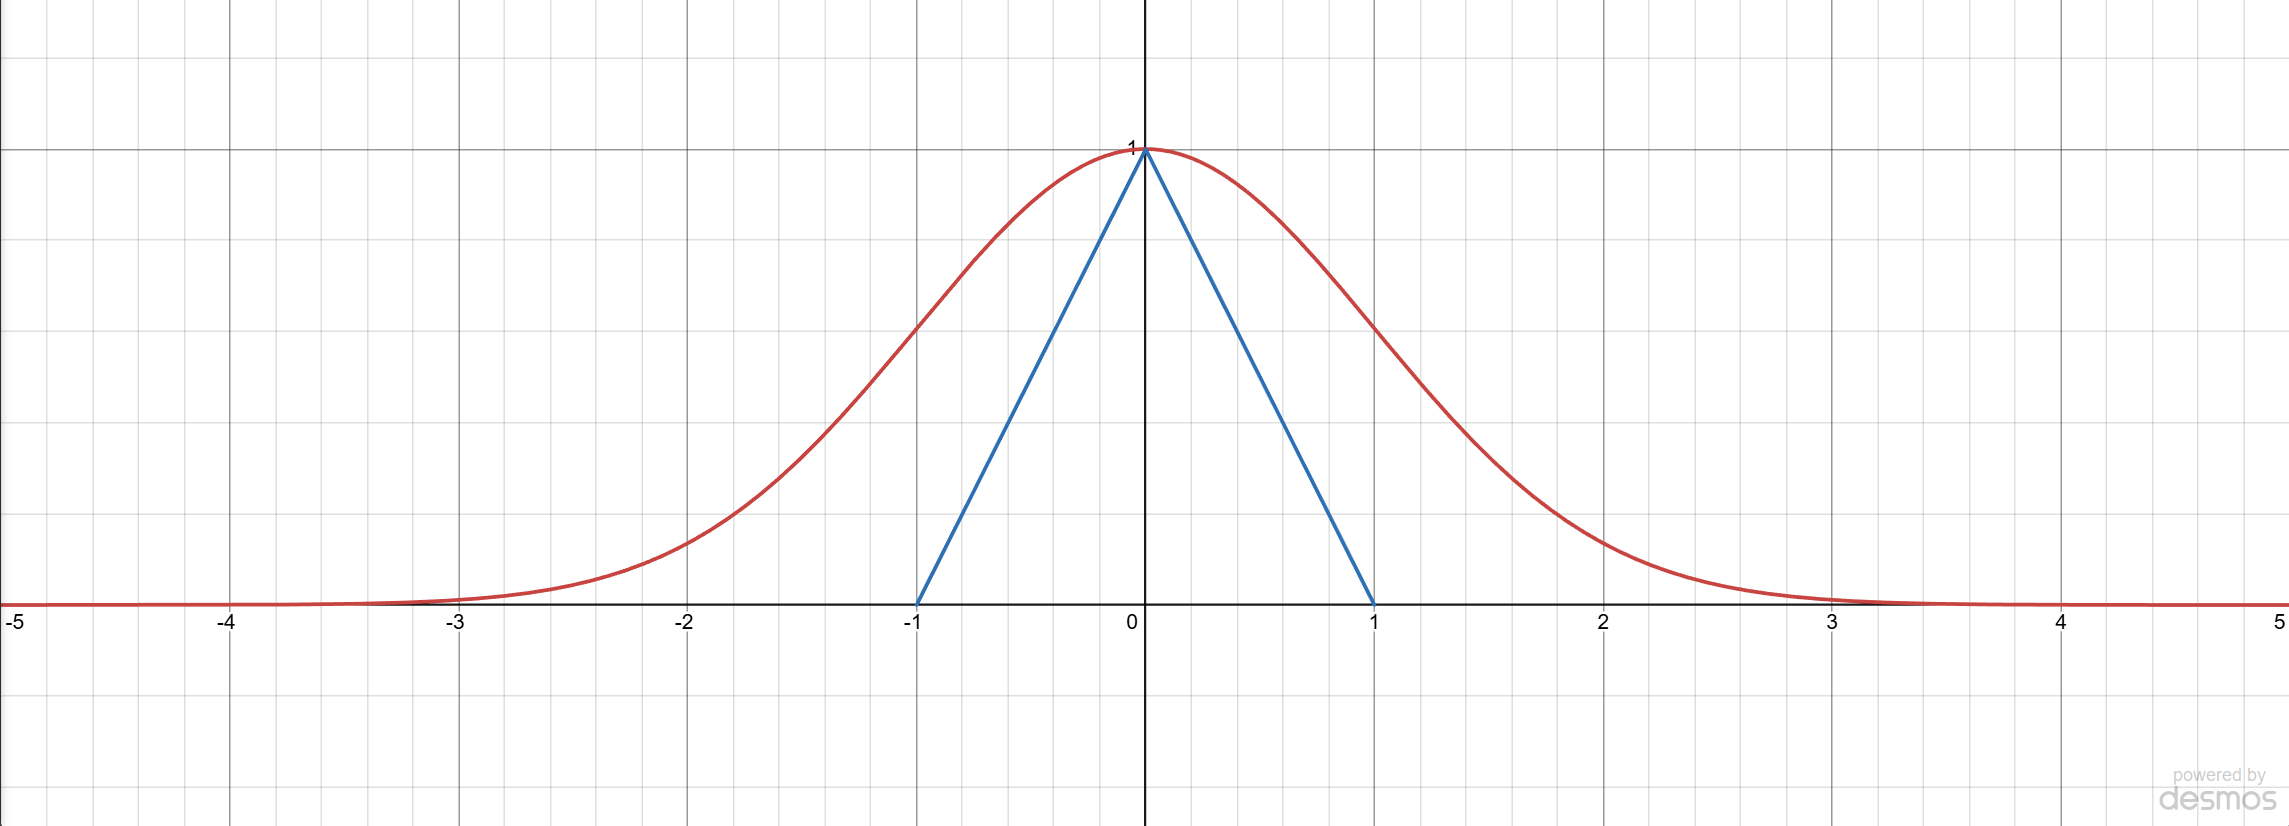
The green is and blue indicates The graph is symmetric around the the -axis ()
(b) (5 points)
Recalling function transformations, what does the plot for look like? Where is this new plot centered? What effect does have in relation to ?
SOLUTION
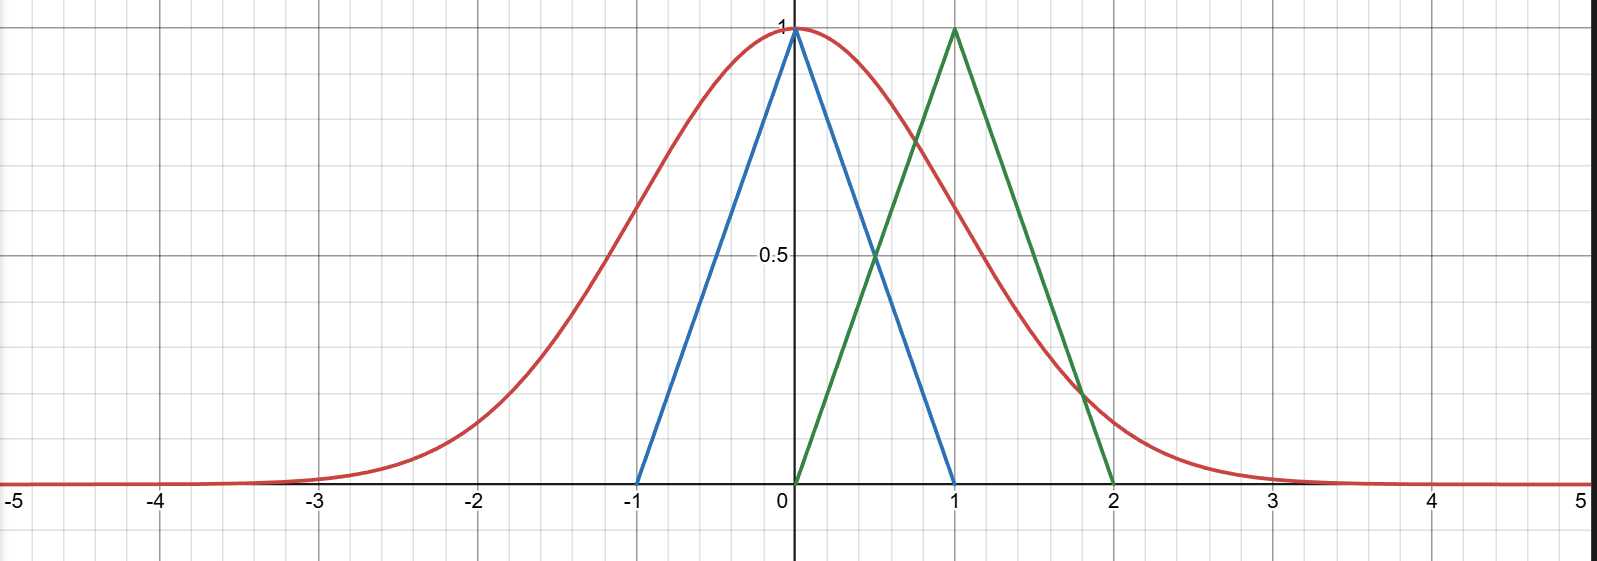
The green is there .
From the graph is clear that it retains the same shape of but transformed to the right by . This new plot is centered at
(c) (5 points)
What is the expression for ? Based on the intuition from part (b), approximately sketch the graph for the function .
SOLUTION
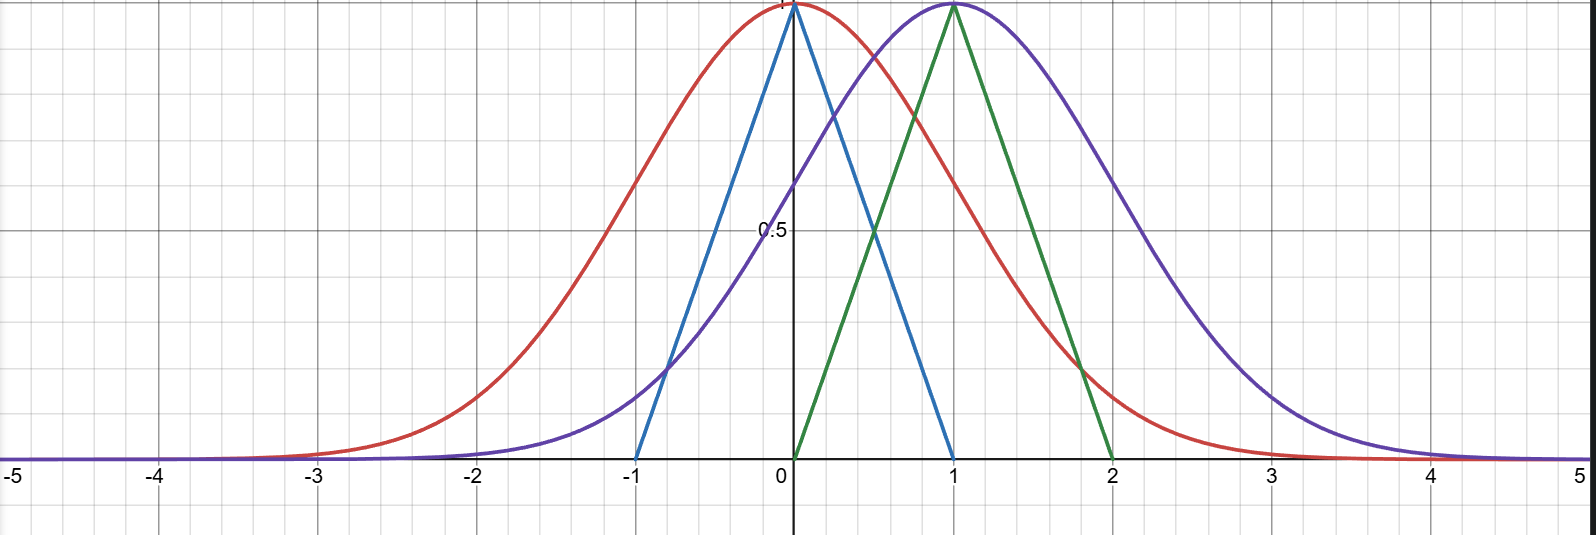
The purple is the when
(d) (5 points)
Recalling function transformations, what does the plot for look like? Where is this new plot centered? What effect does have in relation to ?
SOLUTION
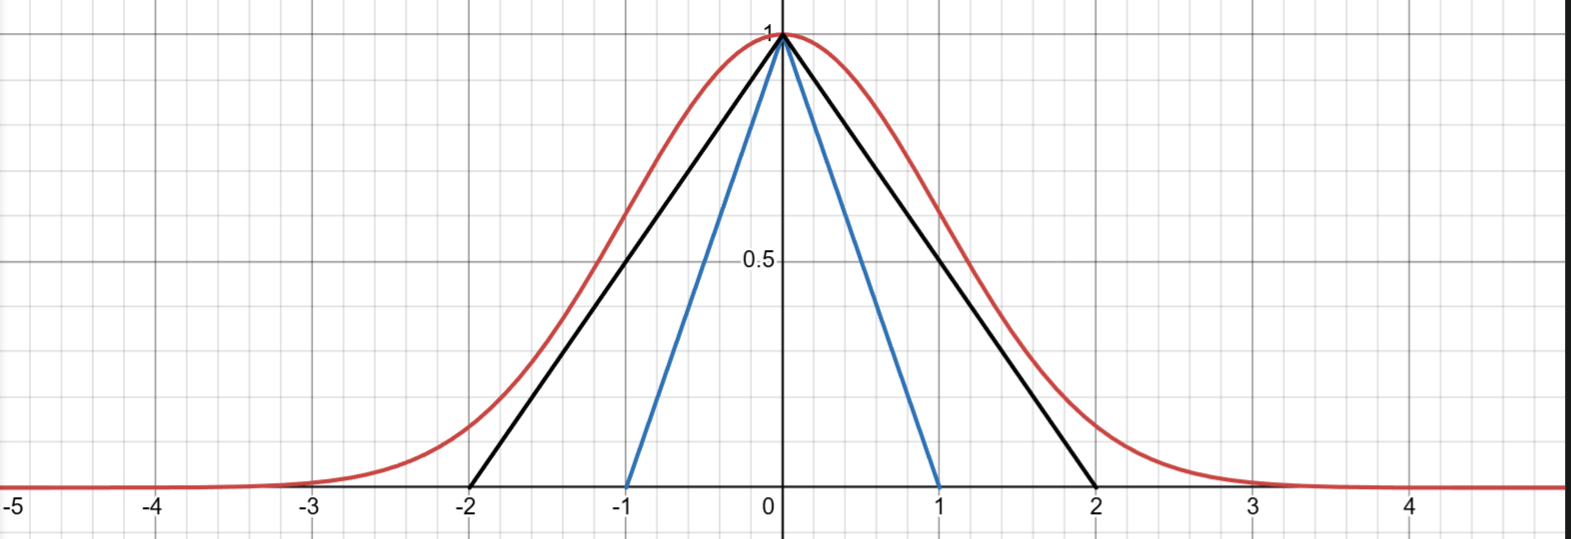
The black line indicates the . This new plot is centered around . The expression effectively spread the original to a wider triangle.
(e) (5 points)
What is the expression for ? Based on the intuition from part (d), approximately sketch the graph for the function .
SOLUTION
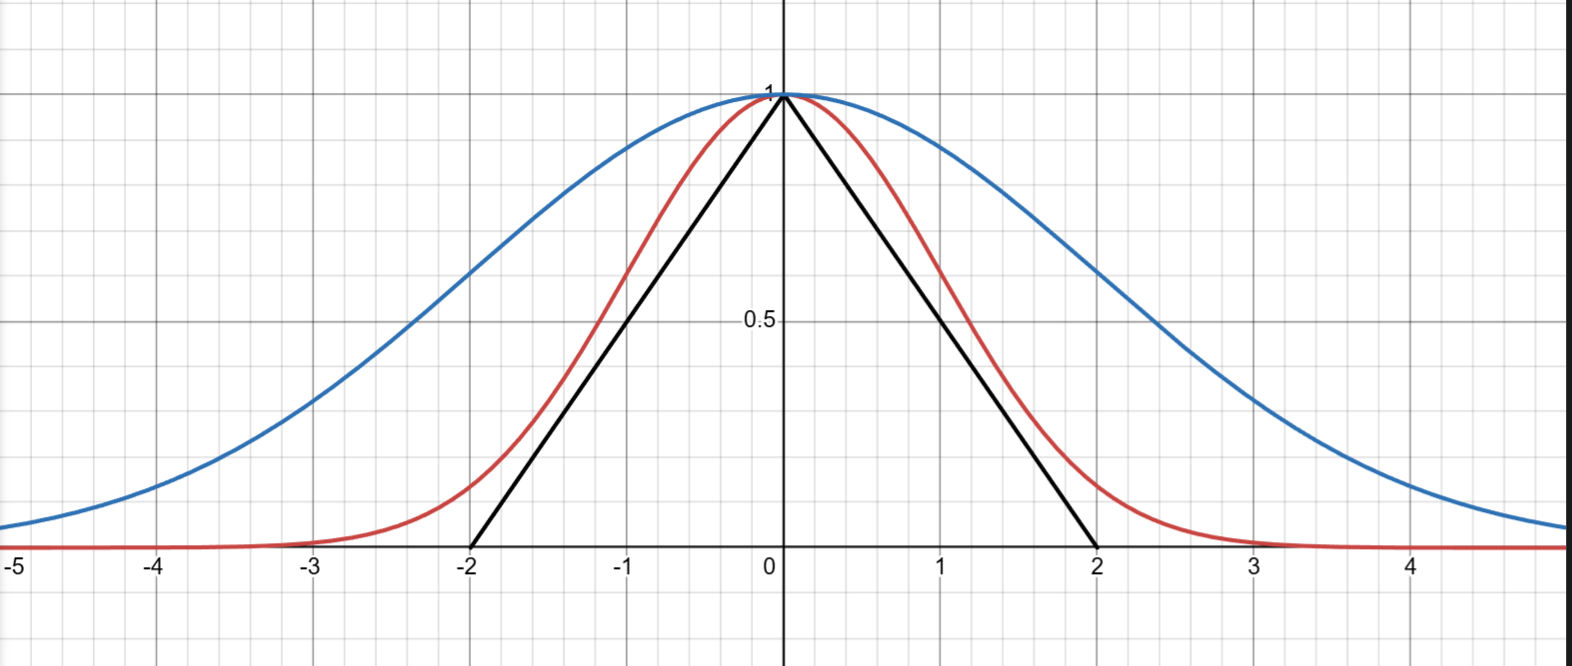
The new blue line indicates the function
The expression for with be the following:
(f) (5 points)
Based on the intuition developed so far, let and be two fixed constants. Write down the expression for . Describe how the graph of the function looks in relation to .
SOLUTION
The new can be written as the following:
Which based on the values of and , they have the following effect in the graph:
- : transforms the graph left and right (right → +, left → -)
- : alters the thickness of the graph (the closer to 0, the thinner the graph shows)
(g) (5 points)
Write down the pdf of the normal distribution with mean and variance , which we have seen in class, and denote this as . Thinking about function transformations, how will the plot of differ from the plot of ? Why do you think we include the leading coefficient in the pdf of the Normal distribution? Without using any calculus, based solely on the PDF of the normal distribution, what must be the area under the curve , taken over all ?
SOLUTION
For , the probability distribution function is the following:
When comparing this to , the following is found:
With this establishment, the function has a multiplier in front, which contributes to the height by a factor of , making the overall graph shorter in height
(h) (5 points)
Given a random variable that is distributed normally with mean and variance , consider the random variable
What does this transformation do to the mean and variance of ?
SOLUTION
Since the random variable , the formula of expected value and variance should be from the normal distributions.
With , finding the expected value and variance will give a better understanding of how the transformation effects the mean and variance
This suggests the transformation shifted the mean from to
This suggest the transformation rescaled the variance from to