Question 1
You’re scrolling through Instagram and you notice that a lot of people are posting selfies. This piques your curiosity and you want to estimate the percentage of photos on Instagram that are selfies.
(a) (5 points) Is there a “ground truth” for the percentage of selfies on Instagram? Why or why not?
Yes, there is a ground truth for the percentage of selfies on instagram because at a specific moment in time, the percentage will be fixed and it will be some percentage that is the true percentage at that moment.
(b) (5 points) Is it possible to estimate the ground truth percentage of selfies on Instagram? Irrespective of your answer to the previous question, you decide to pull up randomly chosen photos from your friends’ Instagram accounts and find that of these photos are selfies.
Yes, it is possible to estimate the ground truth percentage of selfies on Instagram because the calculated percentage () represents the truth in respect to the sample space, which in tern represents the subset of the observations made.
(c) (15 points) Determine which of the following is an observation, a variable, a sample statistic (value calculated based on the observed sample), or a population parameter.
• A photo on Instagram: observation • Whether or not a photo is a selfie: variable • Percentage of all photos on Instagram that are selfies: population parameter • : sample statistic
(d) (5 points) Based on the sample you collected, do you think 32% is a reliable ballpark estimate for the ground truth percentage of all Instagram photos that are selfies? Justify your answer.
I do not think the calculated is a reliable estimate for the ground truth. This is dependent on how big of a portion the photos are in respect to all the Instagram photos. If the takes a good portion of the population () then it could be argued that the percentage is reliable. Otherwise if takes up a very small portion (), then I don’t think it is reliable
2. For this question you will have to refer to the article here.
“Prevalence of depression symptoms in US adults before and during the COVID-19 pandemic.” Ettman et al. JAMA network open 3.9 (2020): e2019686-e2019686.
The study is aimed at understanding the prevalence of depression symptoms in the US before vs. during the COVID-19 pandemic. The dataset is based on individuals’ responses to a survey.
For the following questions, please read the article and pay close attention to the data they collected. You may want to refer to Table 1 and Table 2 in the article.
(a) (5 points) How many observations and variables are in their study?
- Observations: total individuals
- Variables:
(b) (5 points) Based on the article and their main research question, identify the response variable and the explanatory variables.
- Explanatory Variables:
- survey period
- COVID-19 stressor score
- sex
- age group
- race/ethnicity
- education
- marital status
- household income
- household savings
- household size
- Response Variable:
- Depression Symptoms (measured by PHQ-9 score)
(c) (5 points) For each variable, identify the type of variable it represents, i.e., categorical, ordinal, discrete, or continuous.
- Survey Period: Categorical (During COVID-19 or Before COVID-19)
- COVID-19 stressor score: Ordinal
- Sex: Categorical
- Age Group: Categorical
- Race/Ethnicity: Categorical
- Education: Categorical
- Marital Status: Categorical
- Household Income: Categorical
- Household Savings: Categorical (saving is at least $5000 or not)
- Household Size: Discrete
- Depression Symptoms (measured by PHQ-9 score): Categorical
(d) (5 points) How is the data in this study collected? Does this method have any limitations?
Two sets of data were collected:
- During COVID-19:
- Household randomly selected
- excluded PO box-only addresses, addresses not listed in US Postal Service, and newly constructed home
- Age of 18 years or older, can speak English, and completed AmeriSpeak survey
- Before COVID-19:
- from National Health an Nutrition Examination Survey
- selecting primary sampling units by county → census block → households in the 50 states
In summary, the data in this study were collected through random sampling of households throughout the country. Some limitations could be immigrants and new families who either does not speak English or only moved into their newly built home.
3. For this question, we will use the class data from HW-0, which is available as a .csv file on Canvas and is called student_data.csv.
(a) (5 points) How many observations and variables are there in the data?
SOLUTION:
- Observation:
- Variables: (since the consent column all have the value “YES”, it is not a variable)
(b) (5 points) Describe the type for each variable you answered in your survey.
- math183_reason: Nominal / Categorical (Major requirement, Career prospects, Just for fun)
- math183_excited: Ordinal (ranged from “Not at all” to “Very”)
- year: Discrete, Ordinal (ranged from to )
- major: Nominal / Categorical
- sp25_credits: Discrete
- time_reading: Continuous
- time_physical: Continuous
(c) (5 points) Create a boxplot of the number of hours of physical activity by major. Do you see any differences?
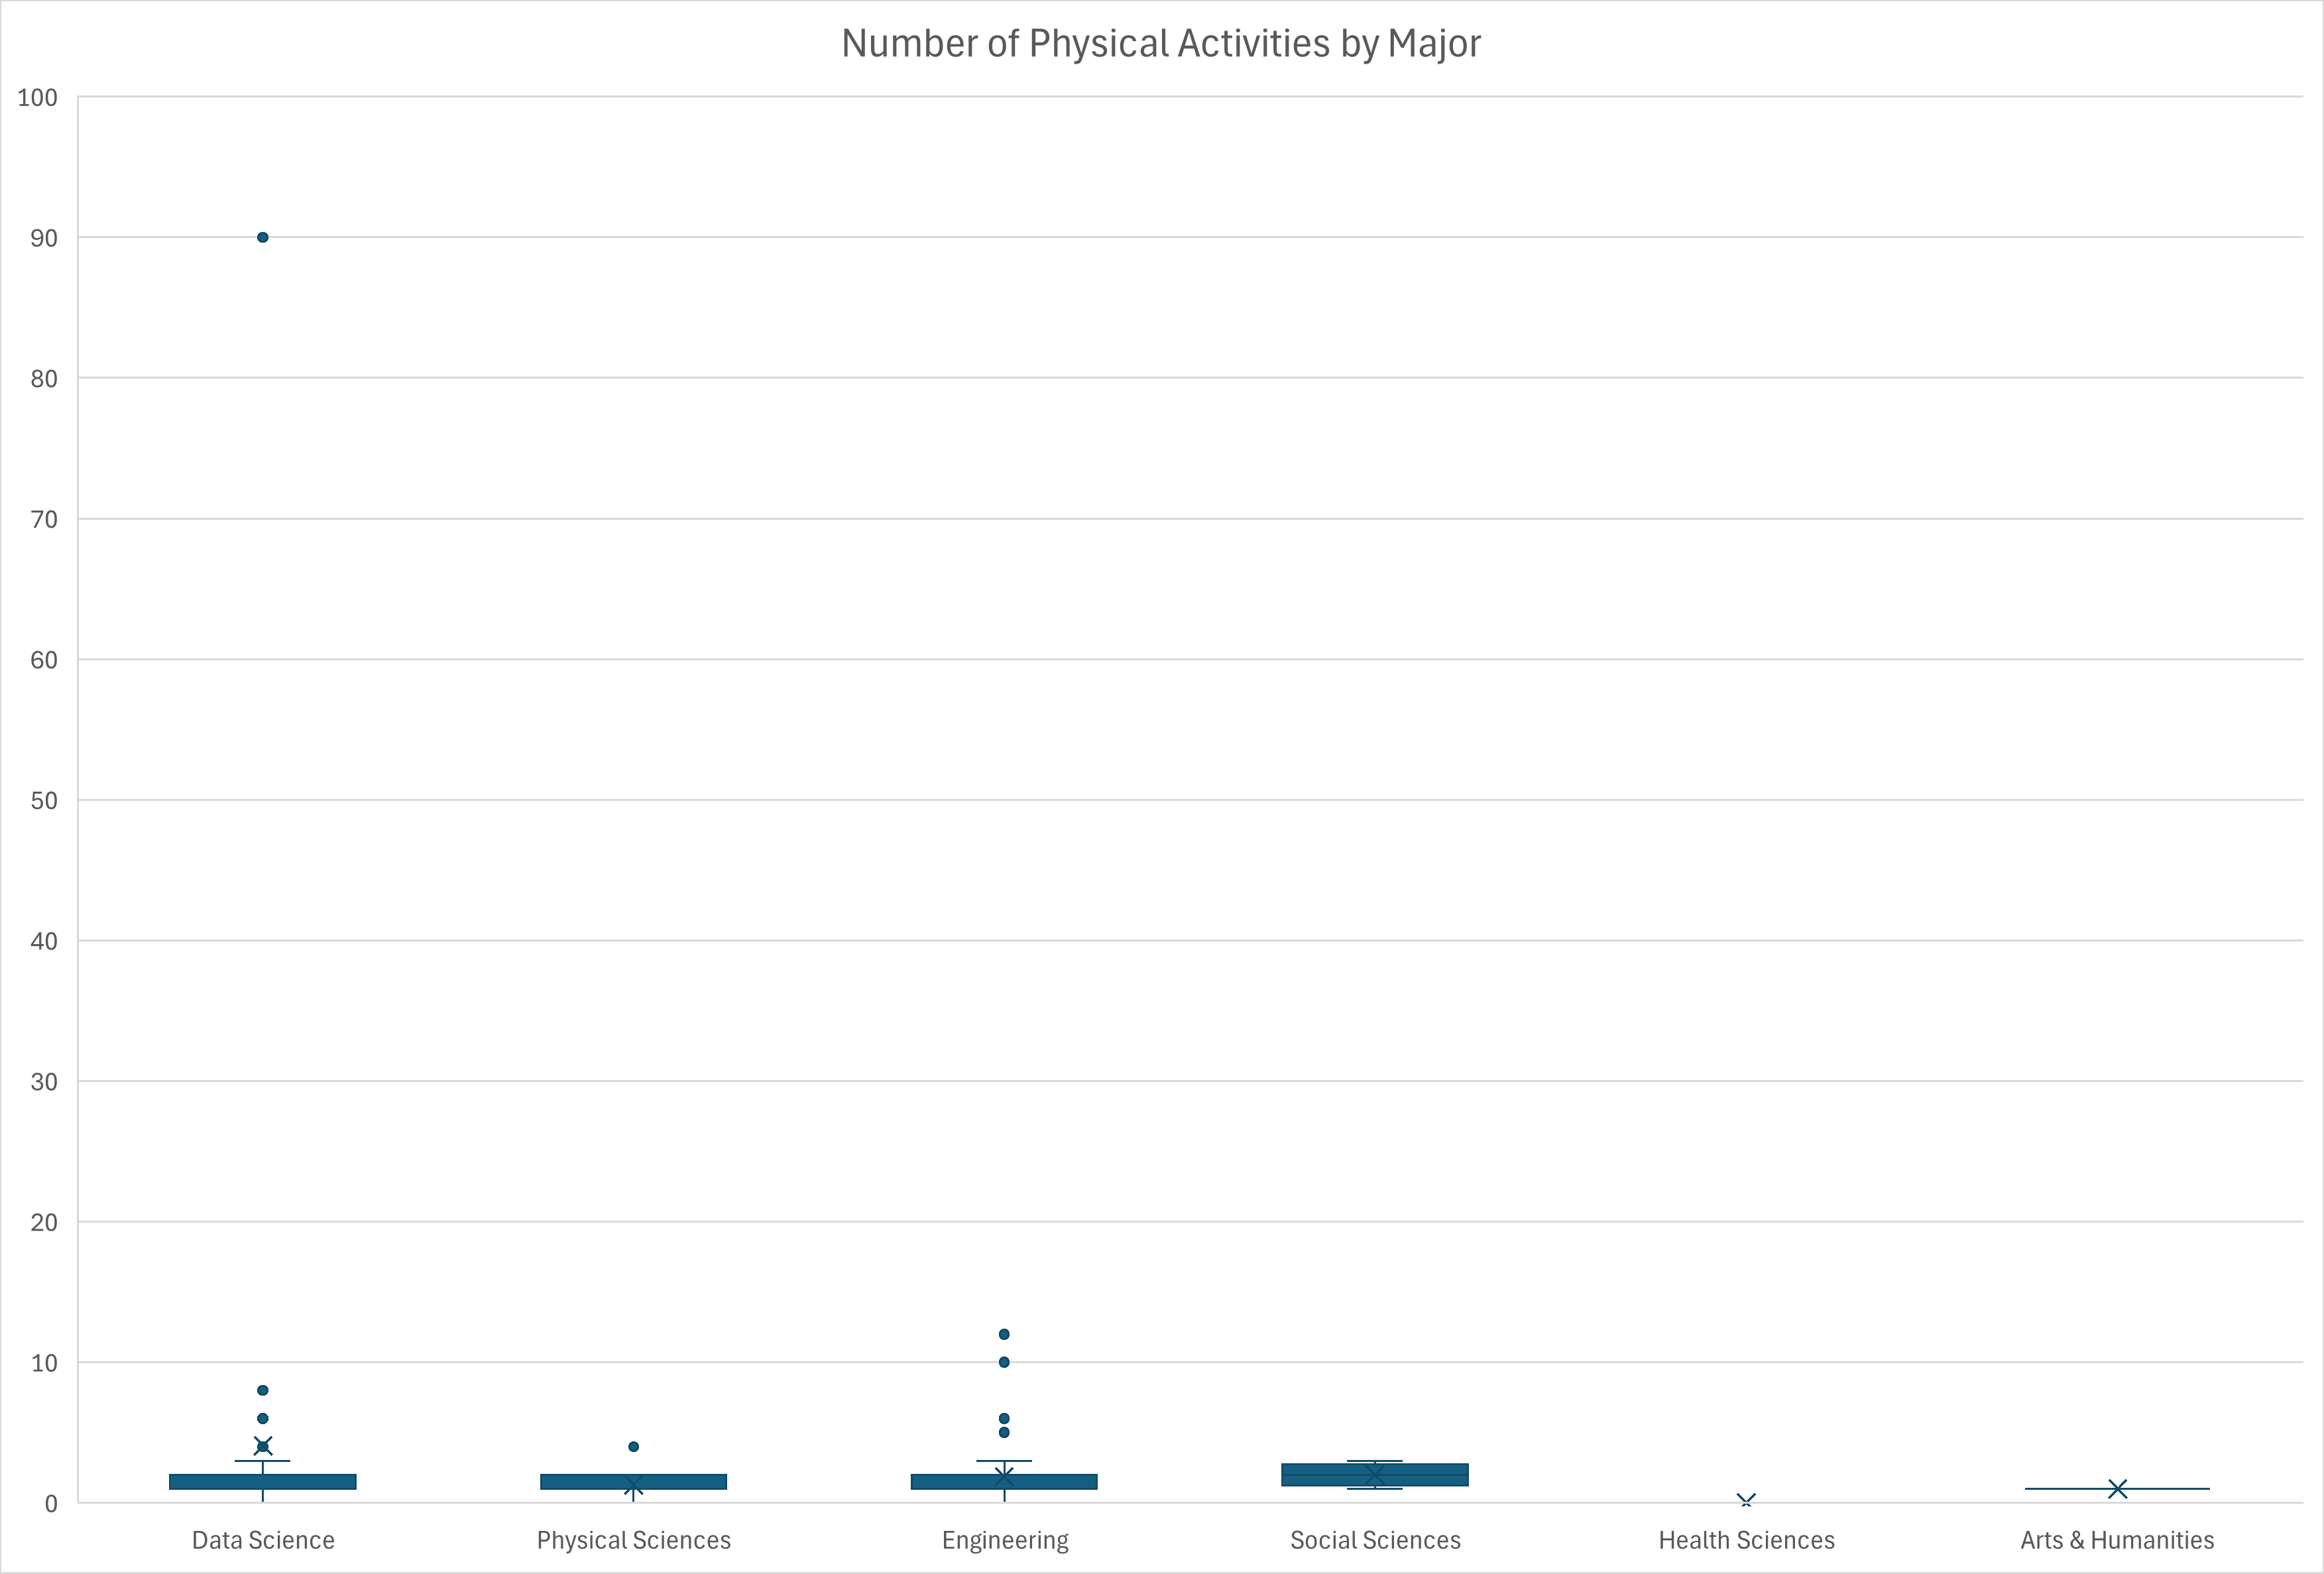
For those majoring in data science, physical sciences, engineering, and social sciences, the difference is not very apparent. However, for health science majors, they seem to have very minimal amount of physical activities and for art and humanities have similar average of physical activity time is almost exactly hour.
(d) (5 points) Based on your answer to the previous question, how confident are you that this finding reflects the true reality?
I am not confident at the findings reflecting the true reality since some majors barely any observation, some others have extreme outliers that effects the overall statistics.
(e) (5 points) Create a bar chart for the overall comfort in the classroom’s seating
Skipped for not having the comfort of classroom seating column
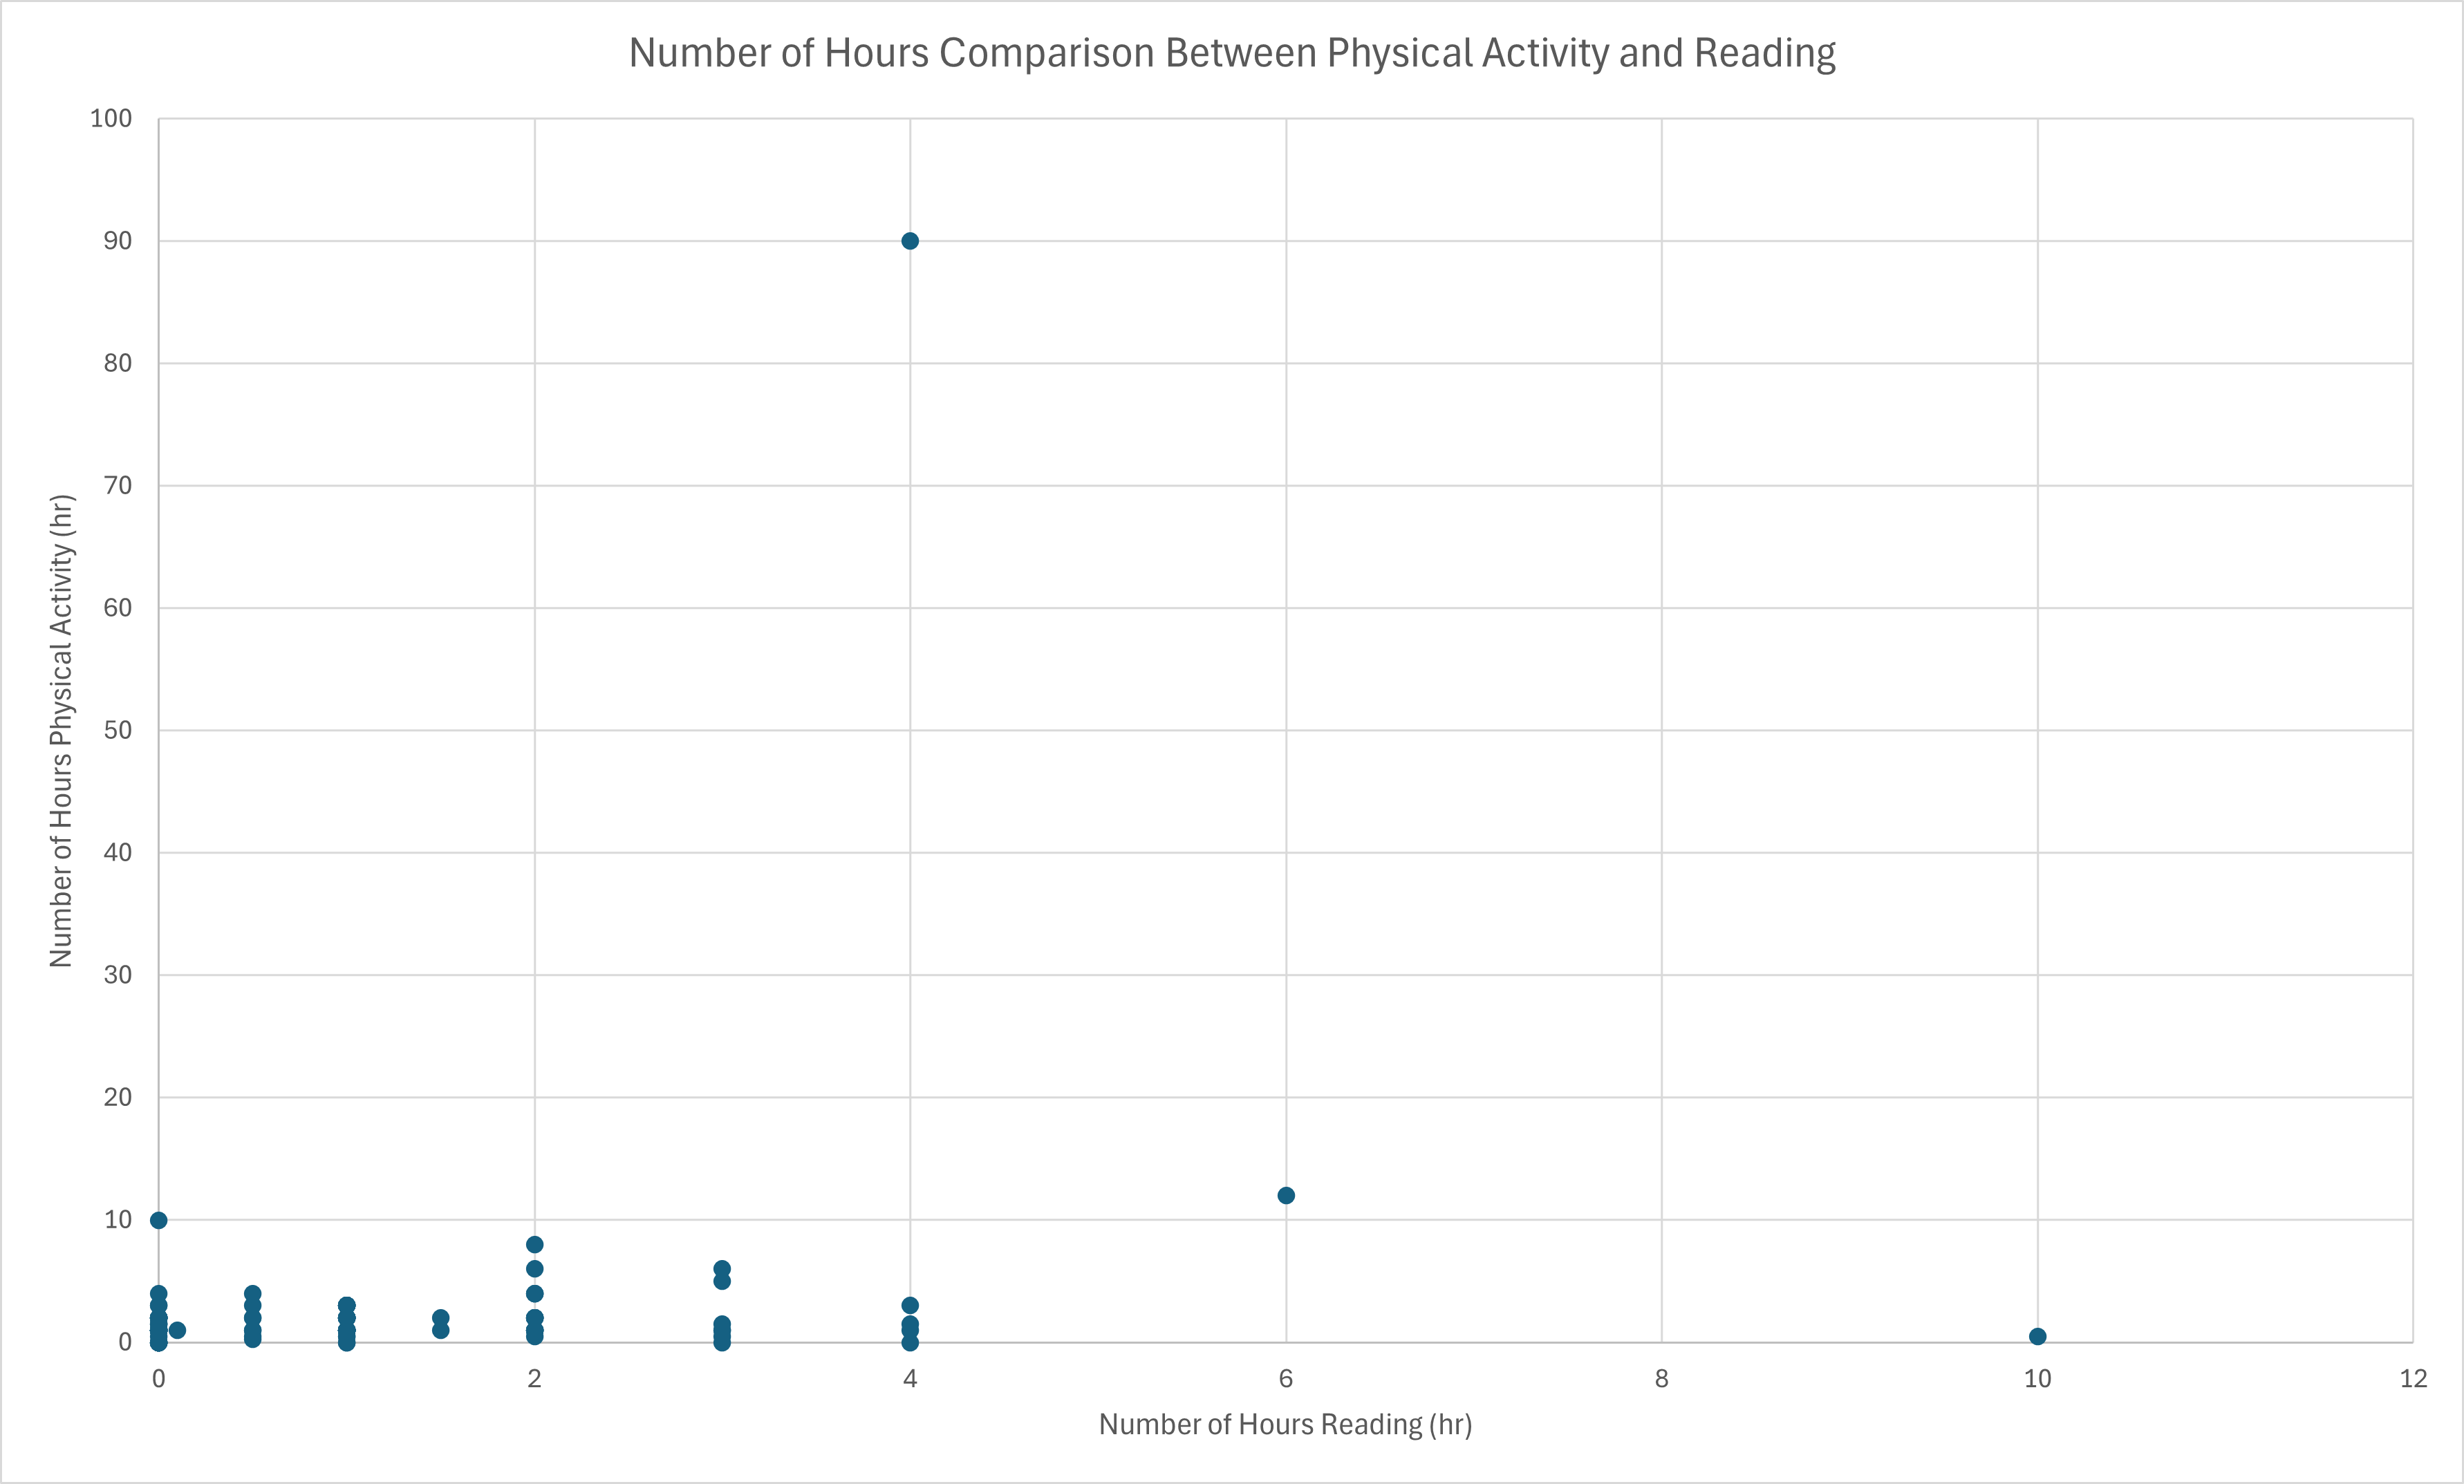
(f) (5 points) Create a scatterplot for the number of hours of physical activity vs reading books
(g) (5 points) Create a histogram for the number of hours people spend reading books.
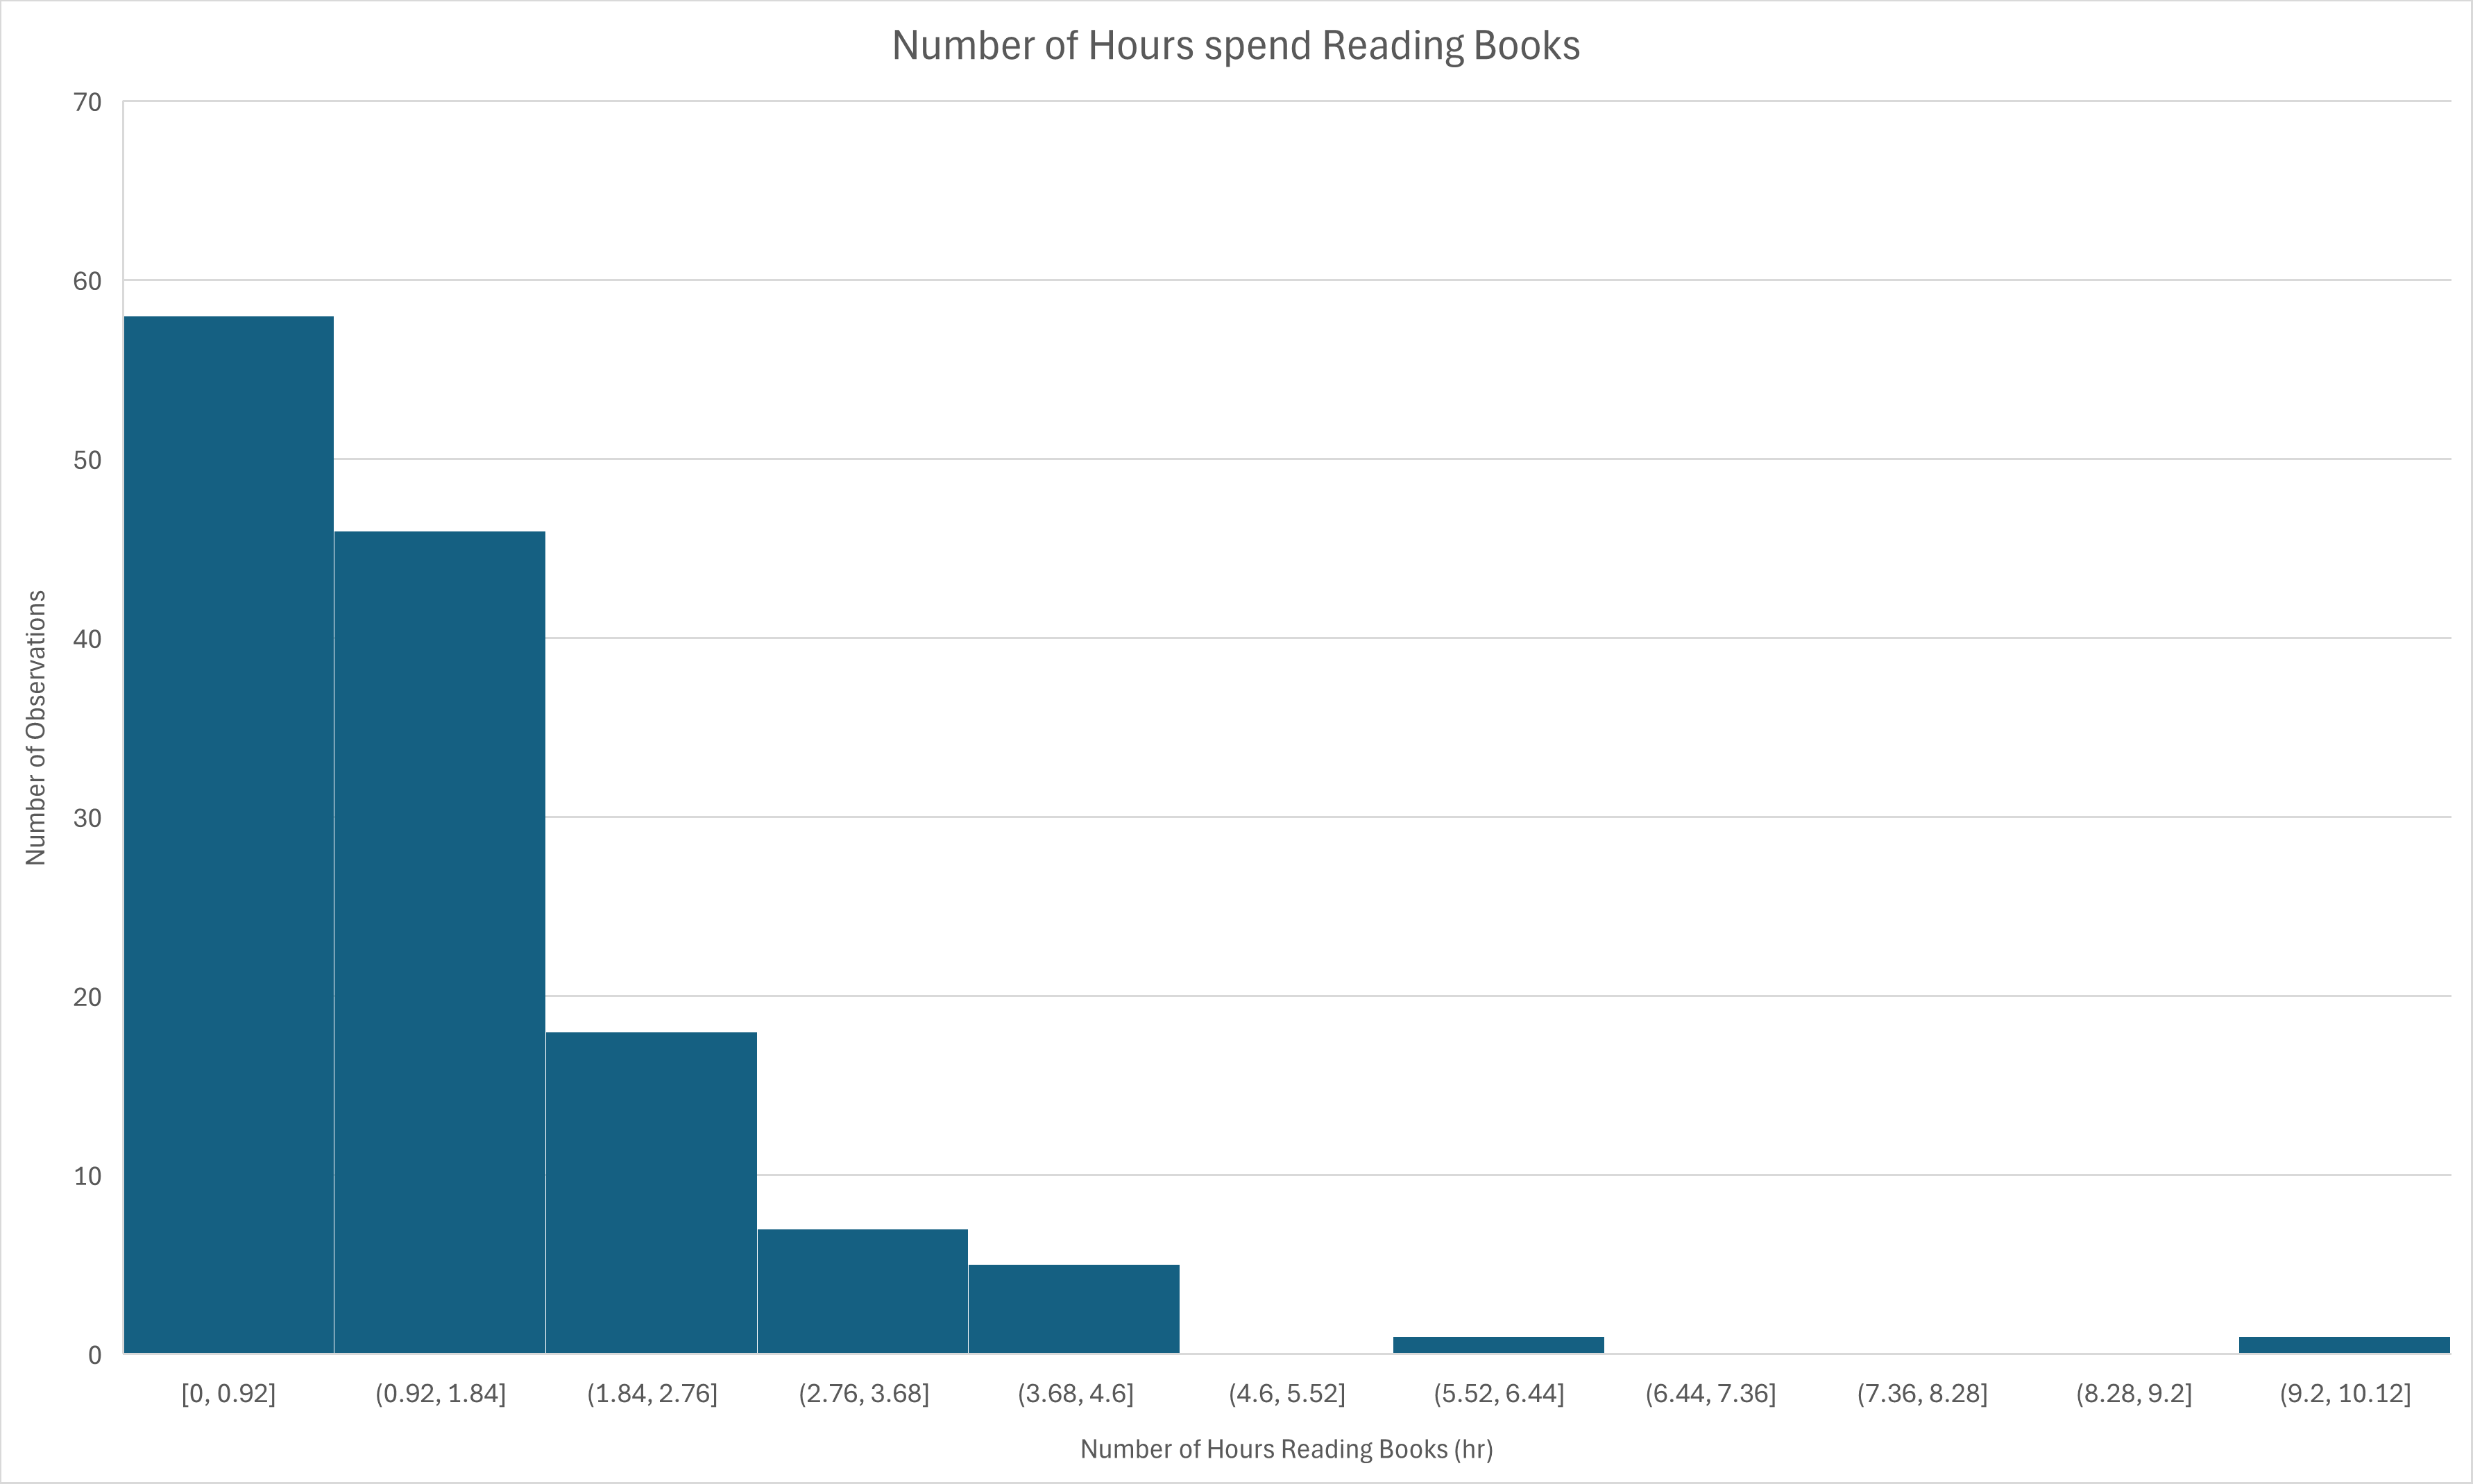
(h) (5 points) What kind of a shape does it represent?
The Histogram shows a right-skewed slope
(i) (5 points) What is the mean, median and mode for the number of credits taken this quarter by people in the class?
- mean: 16.448
- median: 16
- mode: 16
(j) (5 points) What fraction of people in the class are Physical Sciences majors?
Fraction of Physical Sciences majors: