Anatomy of Data
- Observation: An individual unit from which data are collected
- Variable: A characteristic for which different observations can take on different values
- Constant: A characteristic that is the same for all observations
Recognize each parts of data
- A research team recruits adults aged between - to participate IN A -month study. Participants log their daily coffee intake and wear sleep trackers at night to record their sleep quality.
Answer
- Observation:
- The adults
- Variables:
- Coffee consumption frequency
- Sleep quality
- Constant:
- Age Group (all adults are between -)
- office workers are surveyed over a -month period where they report their weekly exercise routines and undergo monthly stress tests
Answer
- Observation:
- The office workers
- Variables:
- Exercise regime
- Stress levels
- Constant:
- Time (all cases are measured in the same span of time, -months)
- households in a city participate in a year-long study where their usage of cooking oil is recorded monthly. Additionally, all adult members undergo quarterly heart health check-ups
Answer
- Observation:
- The households
- Variables:
- Type of cooking oil used
- Heart health indicators
- Constant:
- Geographic location (all households are in the same city)
Types of Variables
- Categorical (Qualitative): Data that describes qualities or characteristics and is used to group information into labels or categories.
- Nominal: Data with no logical order or ranking between categories (e.g., eye color, nationality, or favorite food).
- Ordinal: Data that follows a clear, logical sequence or rank, though the intervals between values are not necessarily equal (e.g., education level, survey ratings like “Satisfied” to “Dissatisfied”, or military rank).
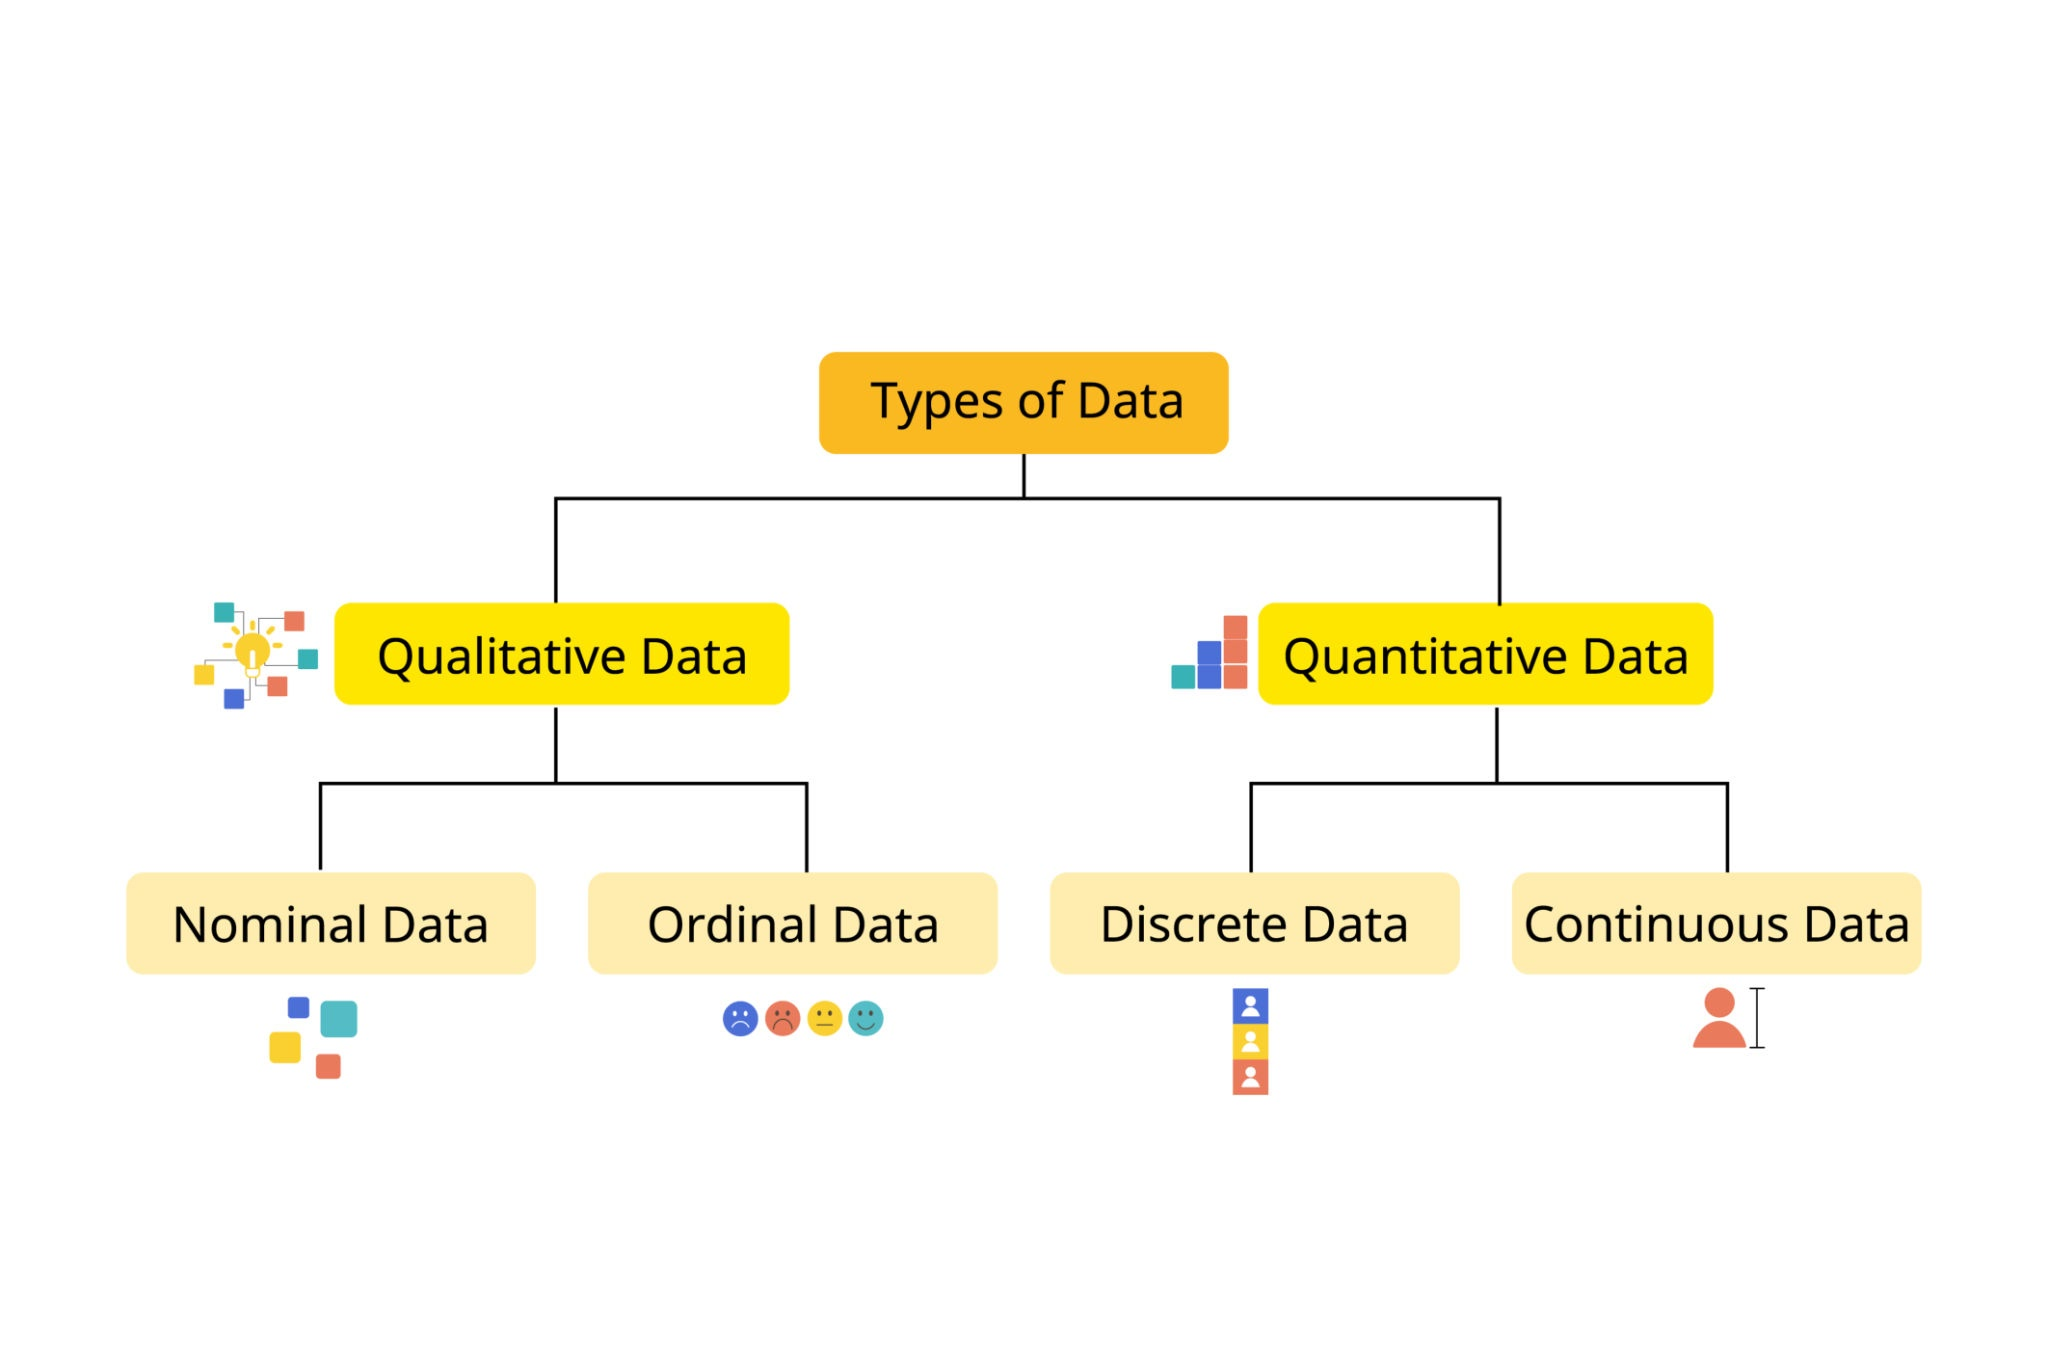
- Numerical (Quantitative): Data that represents measurable quantities and is expressed in numbers for mathematical analysis.
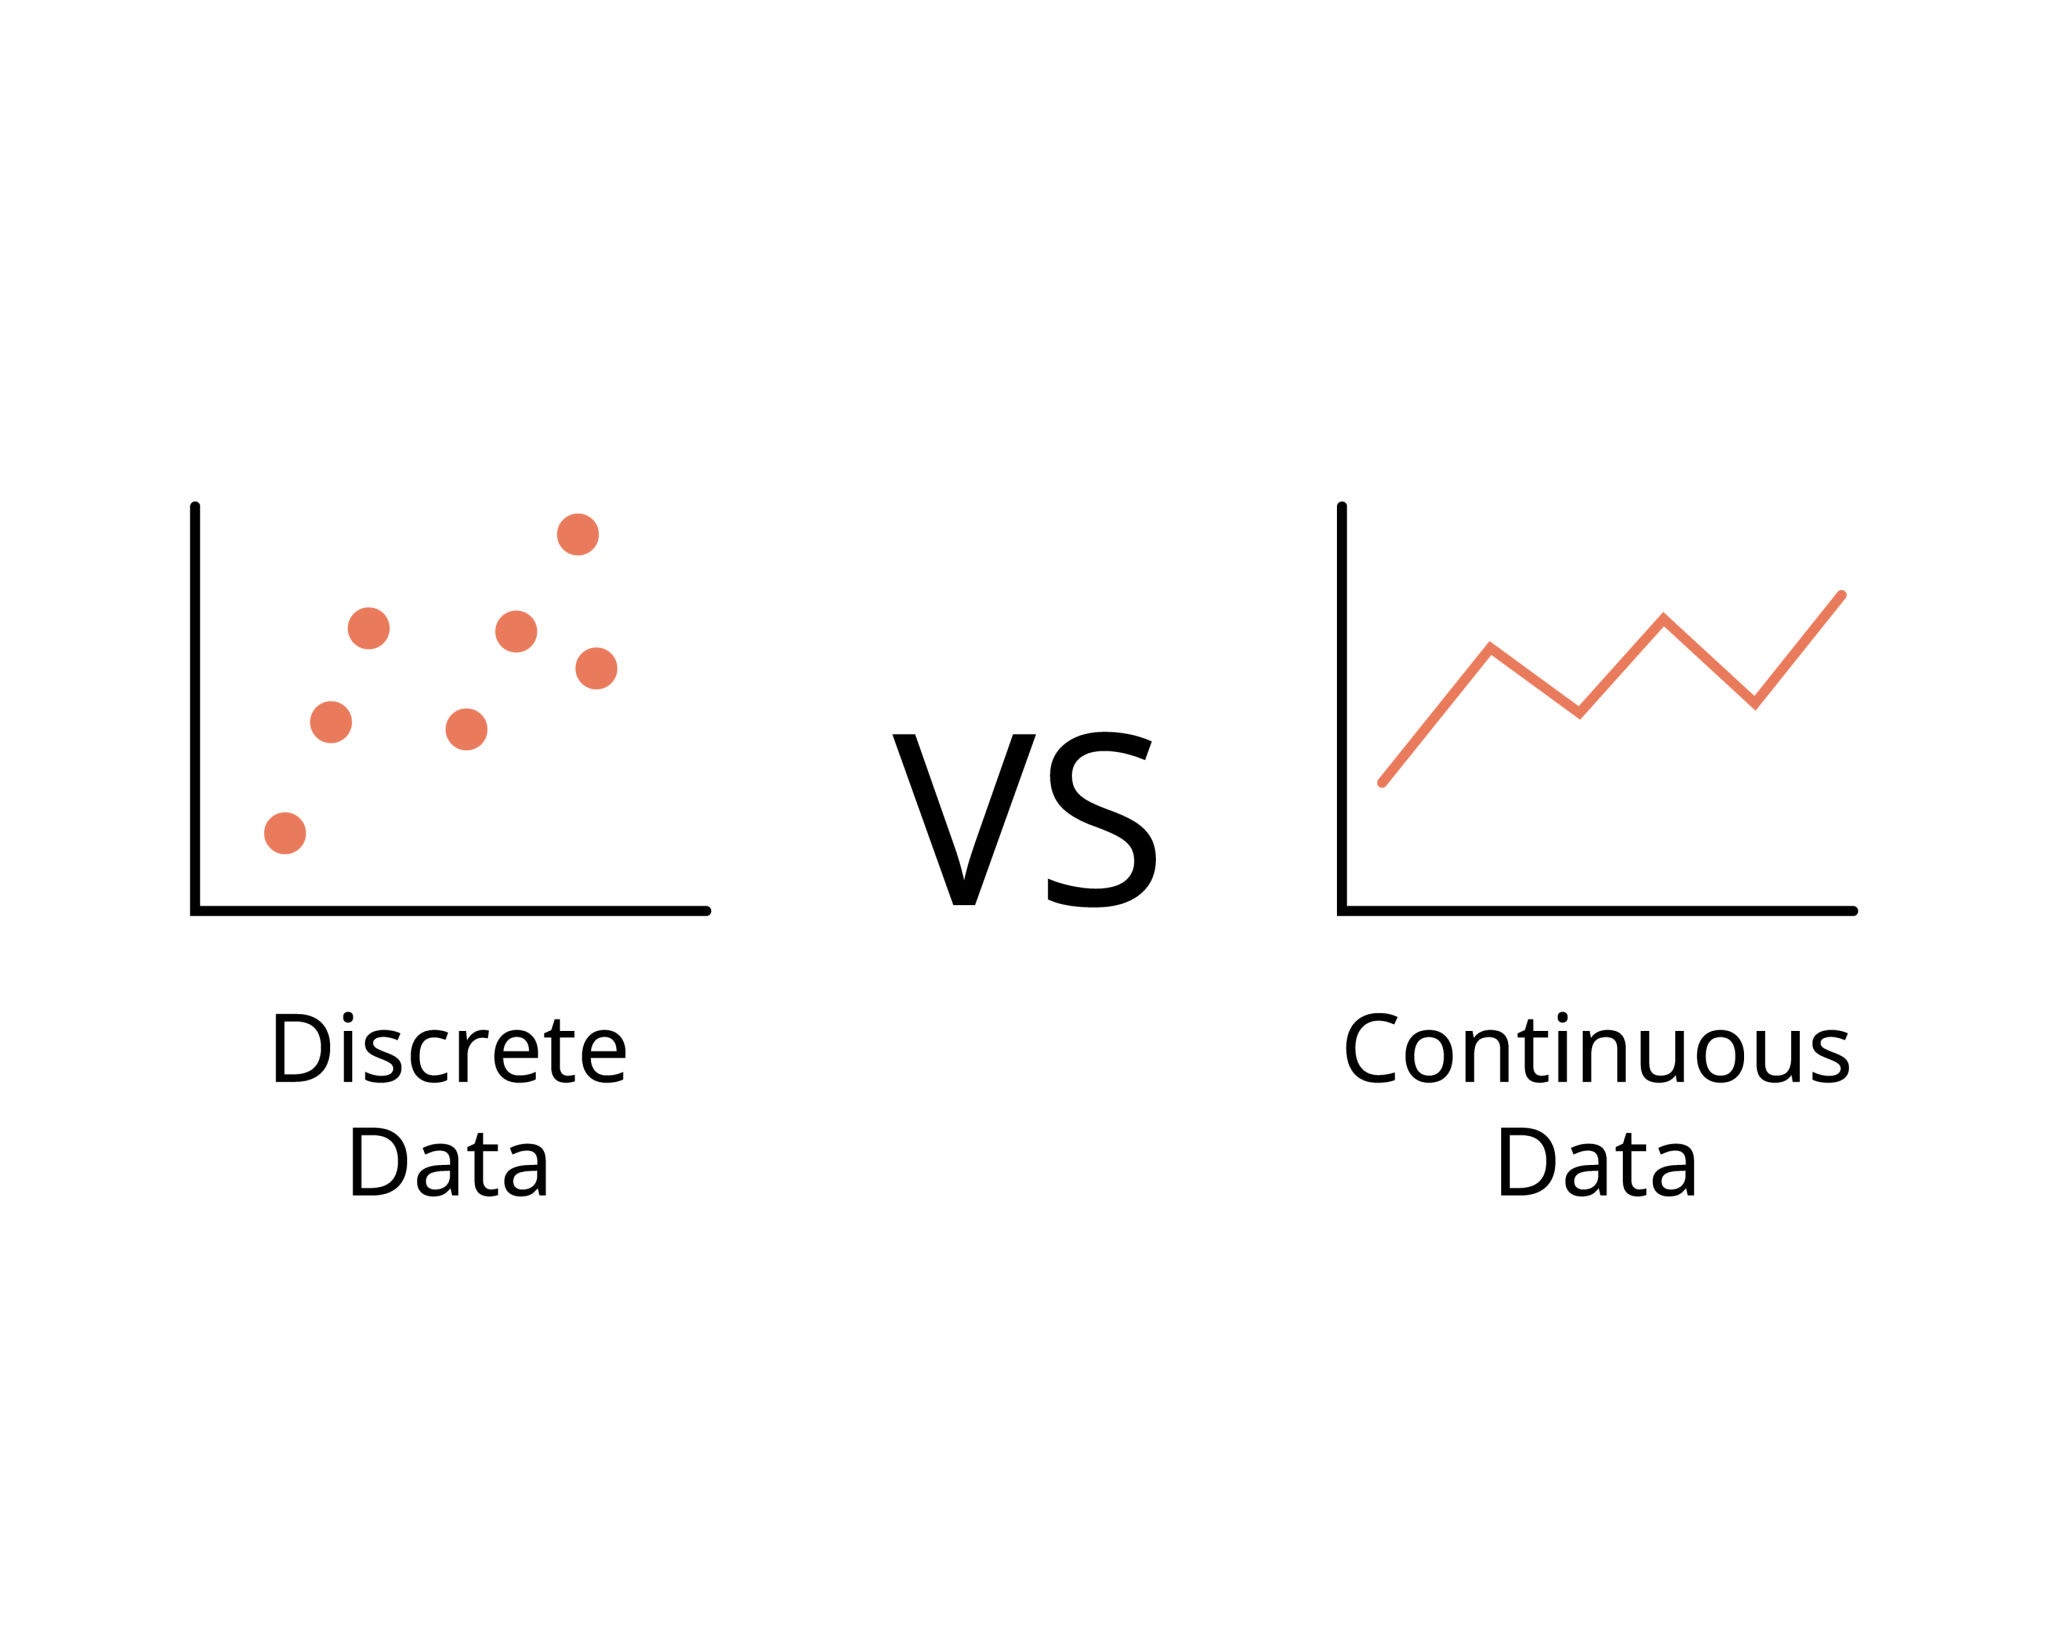
- Continuous: Data that can take any value within a range, including fractions and decimals, often measured with a tool (e.g., precise height, outdoor temperature, or wind speed).
- Discrete: Data consisting of distinct, separate values—usually whole numbers—that are counted rather than measured (e.g., the number of siblings, total goals scored in a game, or the number of items in a shopping cart).
Explanatory vs Response Variables
- Explanatory Variable (Independent / Predictor / ):
- Role: It is the presumed “cause.” In an experiment, the researcher controls or manipulates this variable to see how it affects the subject.
- In Research: If you are studying how fertilizer affects plant growth, the amount of fertilizer is the explanatory variable.
- Visualization: Always plotted on the horizontal x-axis.
- Response Variable (Dependent / Outcome / ):
- Role: It is the “effect” or result. Its value “depends” on the explanatory variable. It is what the researcher measures at the end of the study.
- In Research: Following the fertilizer example, the height of the plant is the response variable.
- Visualization: Always plotted on the vertical y-axis.